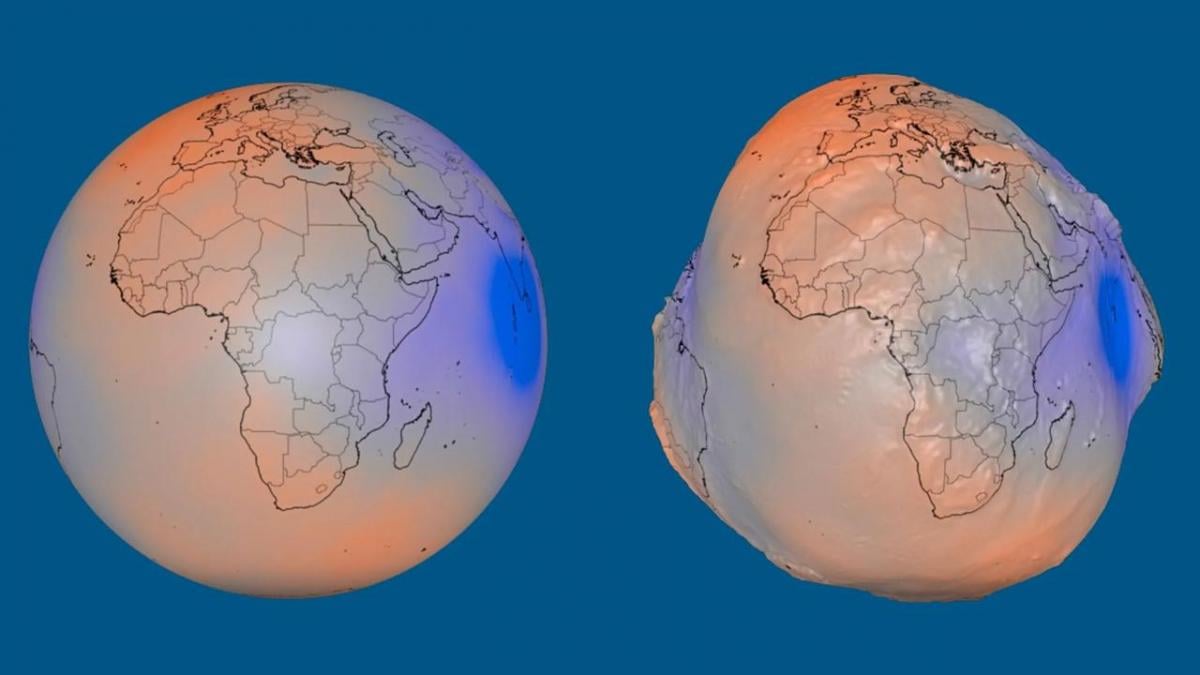
The National Aeronautics and Space Administration has released a visualization depicting Earth as a potato to show gravitational field variations, Euronews reported.
The image shows the planet covered in prominent bulges and depressions rather than a smooth, uniform sphere. Space agency scientists emphasized that the graphic does not represent the physical shape of the planet.
Instead, researchers visualized a geoid, a mathematical model depicting what global ocean sea levels would look like if influenced solely by gravity and planetary rotation. The model removes dynamic surface factors such as ocean tides, waves, winds, and water currents.
Uneven gravity distorts sea levels
Gravitational pull varies across different regions of Earth due to an uneven distribution of mass on the surface and within the interior. Topographic features such as mountain ranges and deep ocean trenches, alongside varying material density inside the crust, alter local gravitational strength.
Where mass is concentrated, stronger gravity pulls sea water slightly upward to create geoid elevations. In areas with weaker gravitational pull, the theoretical sea level remains lower.
To make these subtle gravitational differences clearly visible in the graphic, NASA exaggerated the height variations by 10,000 times. This magnification creates the lumpy appearance of the planet in the rendering.
In reality, the actual difference between the highest point and lowest point of the geoid spans only 191 metres.
Iceland and India mark elevation extremes
The highest point on the geoid is located near Iceland, measuring approximately 85 metres above the reference datum. The lowest point lies south of India, sitting roughly 106 metres below it.
In geodesic modeling, a datum is a smooth, slightly flattened mathematical baseline representing the Earth that scientists use to measure spatial elevation deviations.
Researchers constructed the visualization using more than one billion measurements collected by 19 satellites over a 15-year period. The dataset allows scientists to study the global gravitational field and track environmental mass shifts involving water and ice movement.
Geoid modeling also provides essential practical data for cartography, geodesy, and satellite navigation by enabling accurate height and coordinate measurements across the globe. NASA noted that the potato model remains an exaggerated visual tool rather than a real photograph.
Controversy over solar eclipse map
In separate news concerning the space agency, NASA previously broadcast a map during a live solar eclipse presentation on August 12 that visually separated occupied Crimea from Ukraine, labeling it as part of Russia.
Official NASA documentation regarding the eclipse detailed the geographical path of totality without endorsing changes to internationally recognized borders. The agency stated that the August 12 eclipse was fully visible across parts of Greenland, Iceland, Russia, and Spain, while other countries observed a partial eclipse.