
- WTI crude oil prices consolidate their sideways trend on the first day of the new week.
- The situation favors the bulls and supports the prospects of an upward breakout of the one-week range.
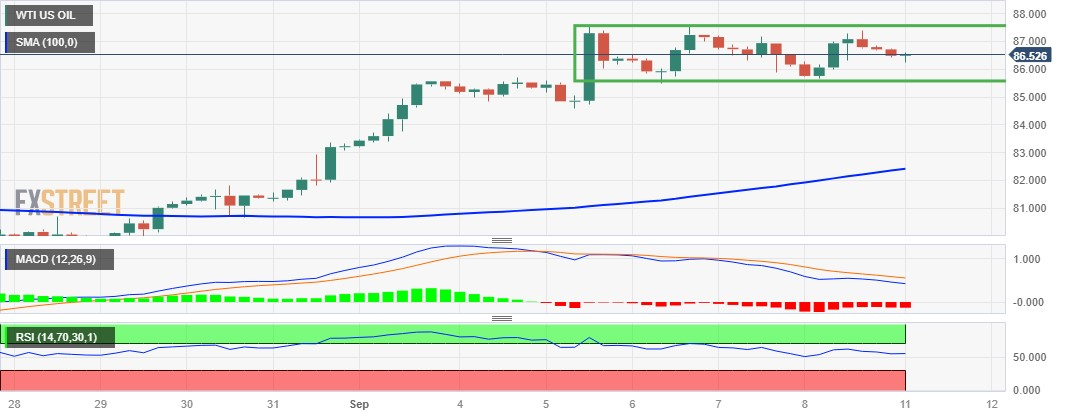
- A break below range support will expose last week’s low around $84.60-$84.55.
The price of WTI crude oil has moved lower during the Asian session on Monday, although it has lacked follow-on selling and has managed to recover initial losses. At the time of writing, WTI is trading sideways around $86.80, gaining about 0.10% on the day.
In the bigger picture, black gold remains stuck in a familiar range that it has maintained for the last week. The prospects of lower global supply, coupled with hopes of a demand recovery in China, continue to act as a tailwind for WTI crude oil prices. In addition, the dollar’s modest decline from the six-month high reached last week is another factor that lends some support to this dollar-denominated commodity.
From a technical point of view, the range-bound price action follows the recent recovery to the highest level since mid-November and could be classified as a bullish consolidation phase. This, along with the bullish oscillators, suggests that the path of least resistance for WTI crude oil prices is up. That said, the Relative Strength Index (RSI) on the daily chart is close to overbought territory and is holding back bulls from opening new positions.
Therefore, it would be prudent to wait for a convincing break through the range resistance, around the $87.55 region, before positioning for further gains. WTI could then accelerate the momentum towards the round $88.00 level on the way towards the intermediate hurdle at $88.60, the $89.00 level and the next relevant barrier near the $89.30-$89.35 area.
On the other hand, the round level of $86.00 could protect the immediate decline ahead of the $85.60-$85.50 zone, which represents the lower limit of the aforementioned range. A convincing break below could trigger some technical selling and pave the way for a significant corrective decline. WTI crude oil prices could fall below the psychological level of $85.00, towards last week’s low, in the $84.60-$84.55 area.
WTI 4-hour chart
WTI additional technical levels
Source: Fx Street
I am Joshua Winder, a senior-level journalist and editor at World Stock Market. I specialize in covering news related to the stock market and economic trends. With more than 8 years of experience in this field, I have become an expert in financial reporting.


