
- The coronavirus crisis in China weighs on the price of WTI, given speculation of lower demand.
- The eurozone’s threat to limit Russian oil supply and the dynamism of the US dollar keep WTI on the defensive.
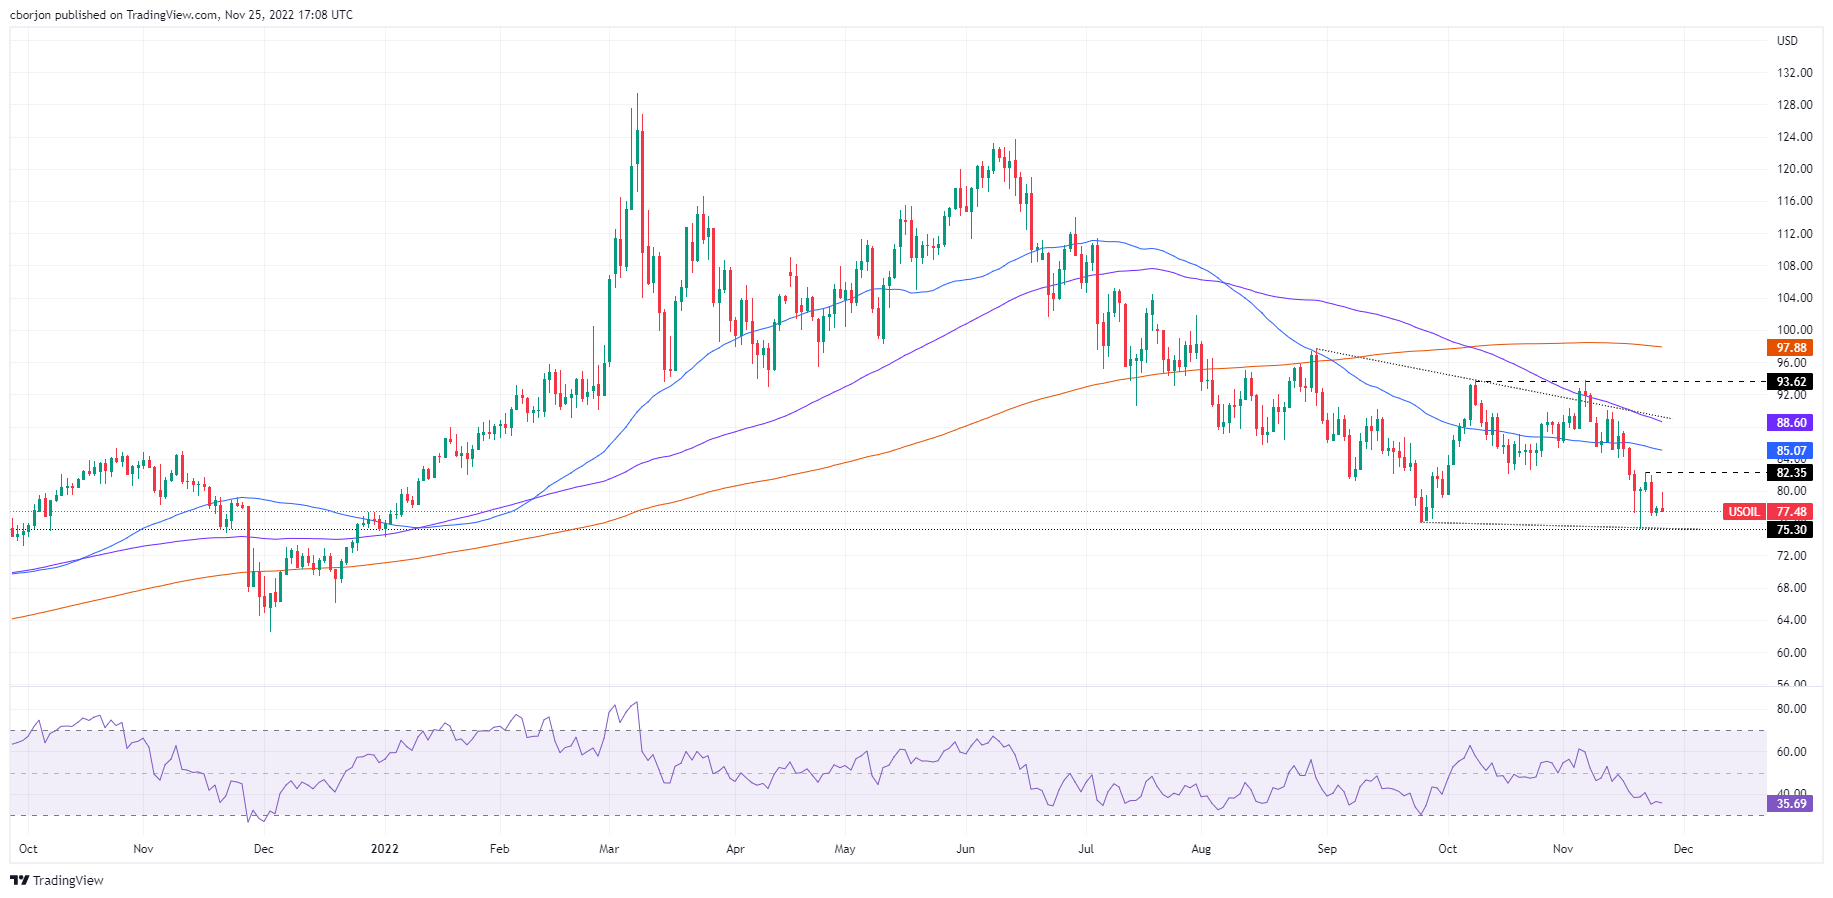
- WTI Price Analysis: A daily close below $80.00 could pave the way for a retest of the all-time low.
The Western Texas Intermediate (WTI), Benchmark US crude oil remains moderately negative on concerns about low demand surrounding the crude market. Factors such as the current outbreak of Covid-19 in China and the reports that appeared during the week about the increase in crude oil production keep the price of WTI stable. At the time of writing this article, WTI trading at $77.46 PB.
Investor sentiment is mixed, partly driven by thin liquidity conditions in the midst of a shortened week due to the Thanksgiving holiday in the US. In addition, the registration of a high number of Covid-19 cases in China could affect the demand for black gold, which weighs on the price of WTI.
Newswires reported that cases peaked at 31,987 on Thursday, up from 29,754 on Wednesday. Earlier in the week, the Chinese authorities revealed measures to relax the Covid-19, with the aim of being less restrictive. However, officials in some cities are reimposing stricter measures and ordering lockdowns as they work to suppress the virus.
Apart from this, reports that the European Union is continuing its talks to impose a price cap on Russian oil, between $65 and $70 per barrel, depressed oil prices.
In addition, the US dollar (USD) appreciated on Friday as there was speculation of short covering in the market. The Dollar Index (DXY), a gauge of the value of the dollar against a basket of six pairs, rose 0.36% to 106,000.
WTI Price Analysis: Technical Perspective
After hitting a weekly high of $82.35 BP on Tuesday, WTI continued its losses throughout the week. Notably, the fall of WTI below $80.00 PB opened the door for further declines and could test the November 21 low of $75.30 if some fundamental reasons increase uncertainty about oil demand. In particular, the Relative Strength Index (RSI) continues to fall, which means that the sellers are gathering momentum.
Therefore, the path of least resistance for WTI is down. The first support for WTI would be $77.00. A break below will expose the November 21 low at $75.30, which, once broken, could send the WTI price down towards its yearly low of $74.30.
Source: Fx Street
I am Joshua Winder, a senior-level journalist and editor at World Stock Market. I specialize in covering news related to the stock market and economic trends. With more than 8 years of experience in this field, I have become an expert in financial reporting.


