
- USDJPY will end the week with losses of over 5%.
- From a daily chart point of view, USDJPY has a neutral bias to the downside if the major pair sustains below the 100 day EMA.
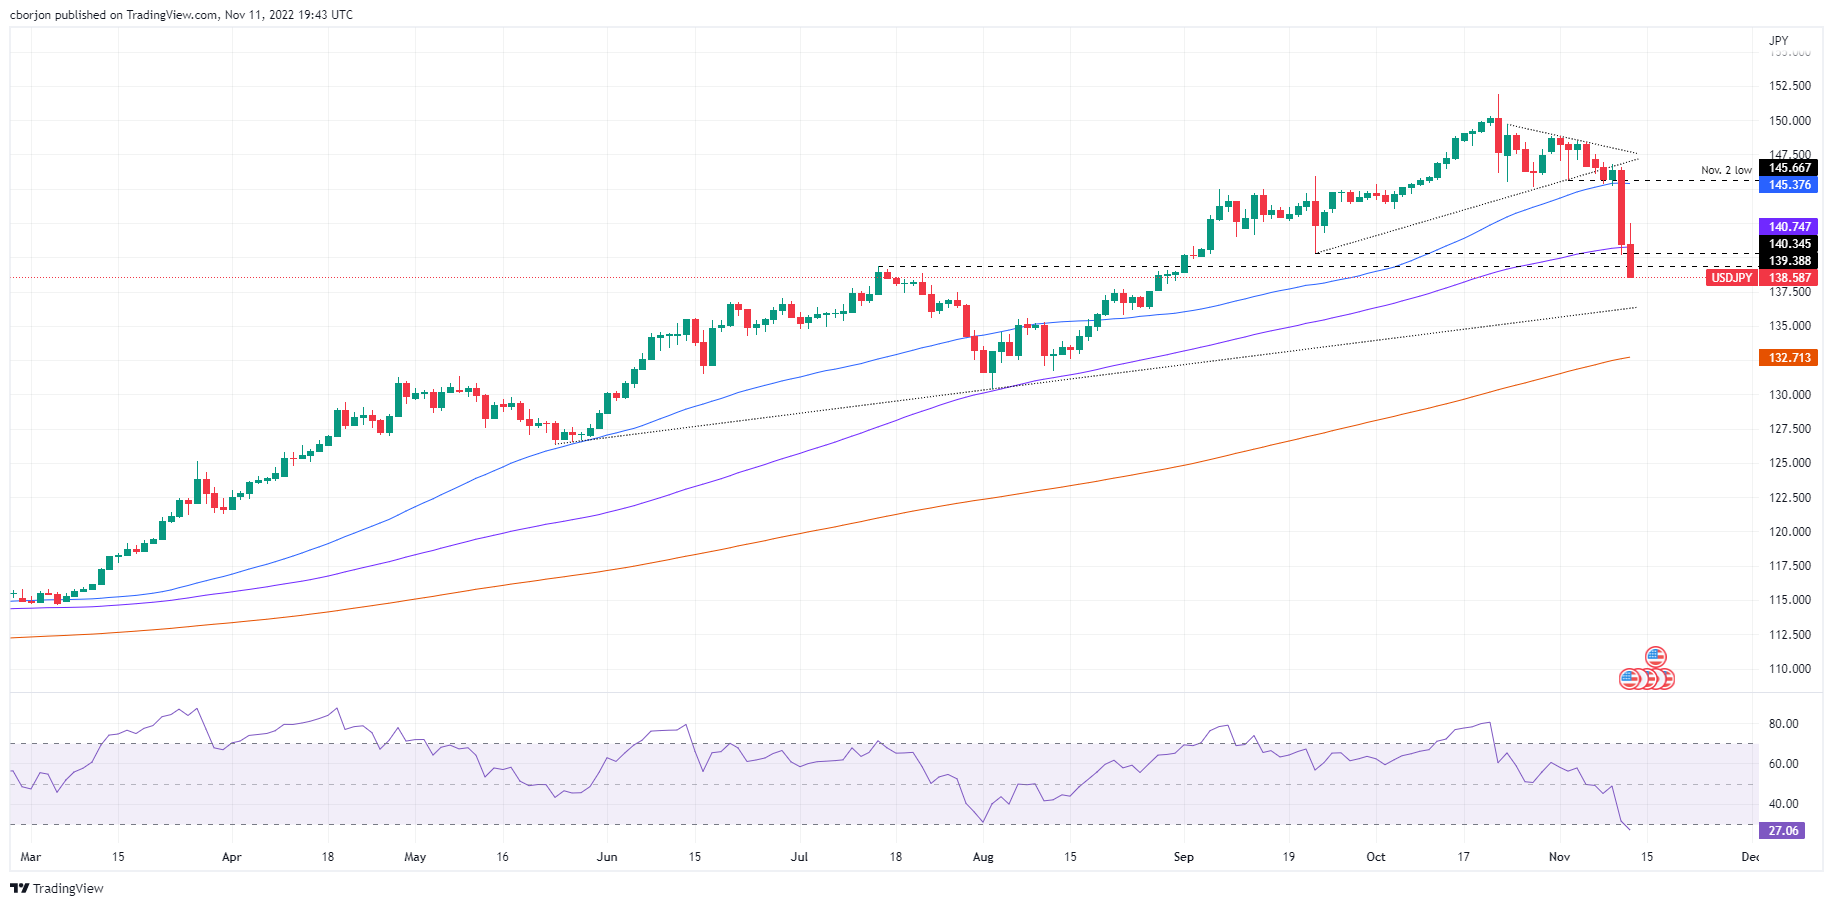
The USDJPY extended its free fall and dropped another 200 points on Friday, below the 100-day EMA at 140.76. Speculation that the Federal Reserve could slow the pace of rate hikes and falling US Treasury yields are the two main factors weighing on the US dollar (USD). As such, USDJPY trades at 138.54, down 1.73% from its opening price.
USDJPY Price Analysis: Technical Outlook
USDJPY shows that Thursday’s price action broke a month-long support trendline, exacerbating a decline towards the 100-day EMA at 140.74. On Friday, USDJPY hit a daily high around 142.50 before falling sharply as buyers failed to break above the 22 Sep swing low at 140.34, changing the pair’s bias from neutral to neutral down. The Relative Strength Index (RSI) fell into bearish territory, entering oversold conditions.
Even though USDJPY broke through key support levels, a breakout of the 200 day EMA is needed for Japanese yen (JPY) buyers to be in charge. Otherwise, USDJPY could be subject to buying pressure.
Therefore, the first support for the USDJPY would be the 138.00 figure. If it breaks below, the psychological level of 137.50 will be exposed, followed by buying of a six-month uptrend line that passes through 136.50, before 136.00.
On the other hand, the first resistance for USDJPY would be the daily high of July 14 at 139.38, followed by the psychological level of 140.00, before the 100 day EMA.
USDJPY Key Technical Levels
Source: Fx Street
With 6 years of experience, I bring to the table captivating and informative writing in the world news category. My expertise covers a range of industries, including tourism, technology, forex and stocks. From brief social media posts to in-depth articles, I am dedicated to creating compelling content for various platforms.


