
- USD/MXN is holding on to its gains, hovering around $18.58, after strong US data.
- The US labor market data shows a tight labor market, while the PPI came out above expectations.
- USD/MXN Price Analysis: Still neutral to the downside, but positive divergence could warrant a rally to $19.00.
The Mexican peso (MXN) lost some ground against the US dollar (USD) on Thursday after the release of US economic data, which sparked speculation that there could be more rate hikes than just two from the Federal Reserve (Fed), as and as money market futures data showed. At the time of writing these lines, the USD/MXN pair was trading around $18.6481.
On Thursday, the US economic calendar is very tight. Turning to inflation, the Producer Price Index (PPI) for January rose 0.7%m/m, above estimates of 0.4%, while the core PPI, which excludes volatile items, stood at 0.5%. vs. 0.3% forecast. Although the year-on-year data was lower than the previous month, the monthly figures highlight the continued stickiness of inflation, which could require further tightening by the Fed.
On the other hand, initial jobless claims for the week ending February 11 stood at 194,000, down from the previous reading of 196,000, and below the 200,000 forecast by analysts, underscoring the tightness of the labor market, which is still pending to show the effects of a 450 basis point rate hike by the Fed.
In other data, the Philadelphia Fed Manufacturing Index fell below estimates of -7.4 to -24.3. The survey showed that the increase in costs accelerated for the first time in 10 months, contrary to its own prices, which slowed.
According to Reuters, “both measures of prices in the survey, those paid by producers and those they charge their customers – both closely watched indicators of inflation – showed that margins were narrowing. The price paid index rose to 26.5 from 24.5 to mark its first rise since April 2022, while the default price index fell 50% to 14.9, the lowest reading since February 2021.”
Meanwhile, the USD/MXN regained some composure after hitting a low of 18.5361. Although it hit a daily high of 18.6832, it has remained under pressure, driven by market sentiment, with impulses from risk appetite increasing demand for the Mexican peso.
Separately, Cleveland Fed President Loretta Mester said she sees compelling evidence to raise rates by 50 basis points in upcoming meetings. The president of the Cleveland Fed, Loretta Mester, affirmed that she sees convincing signs to raise rates 50 basis points in the next meetings, that she sees risks to the upside in inflation and that it justifies that the scenario supports the arguments in favor of a policy “Too Tight” Monetary Policy: “Too tight also has costs, but if inflation starts to come down faster than expected, we can react appropriately,” Mester said.
USD/MXN Technical Analysis
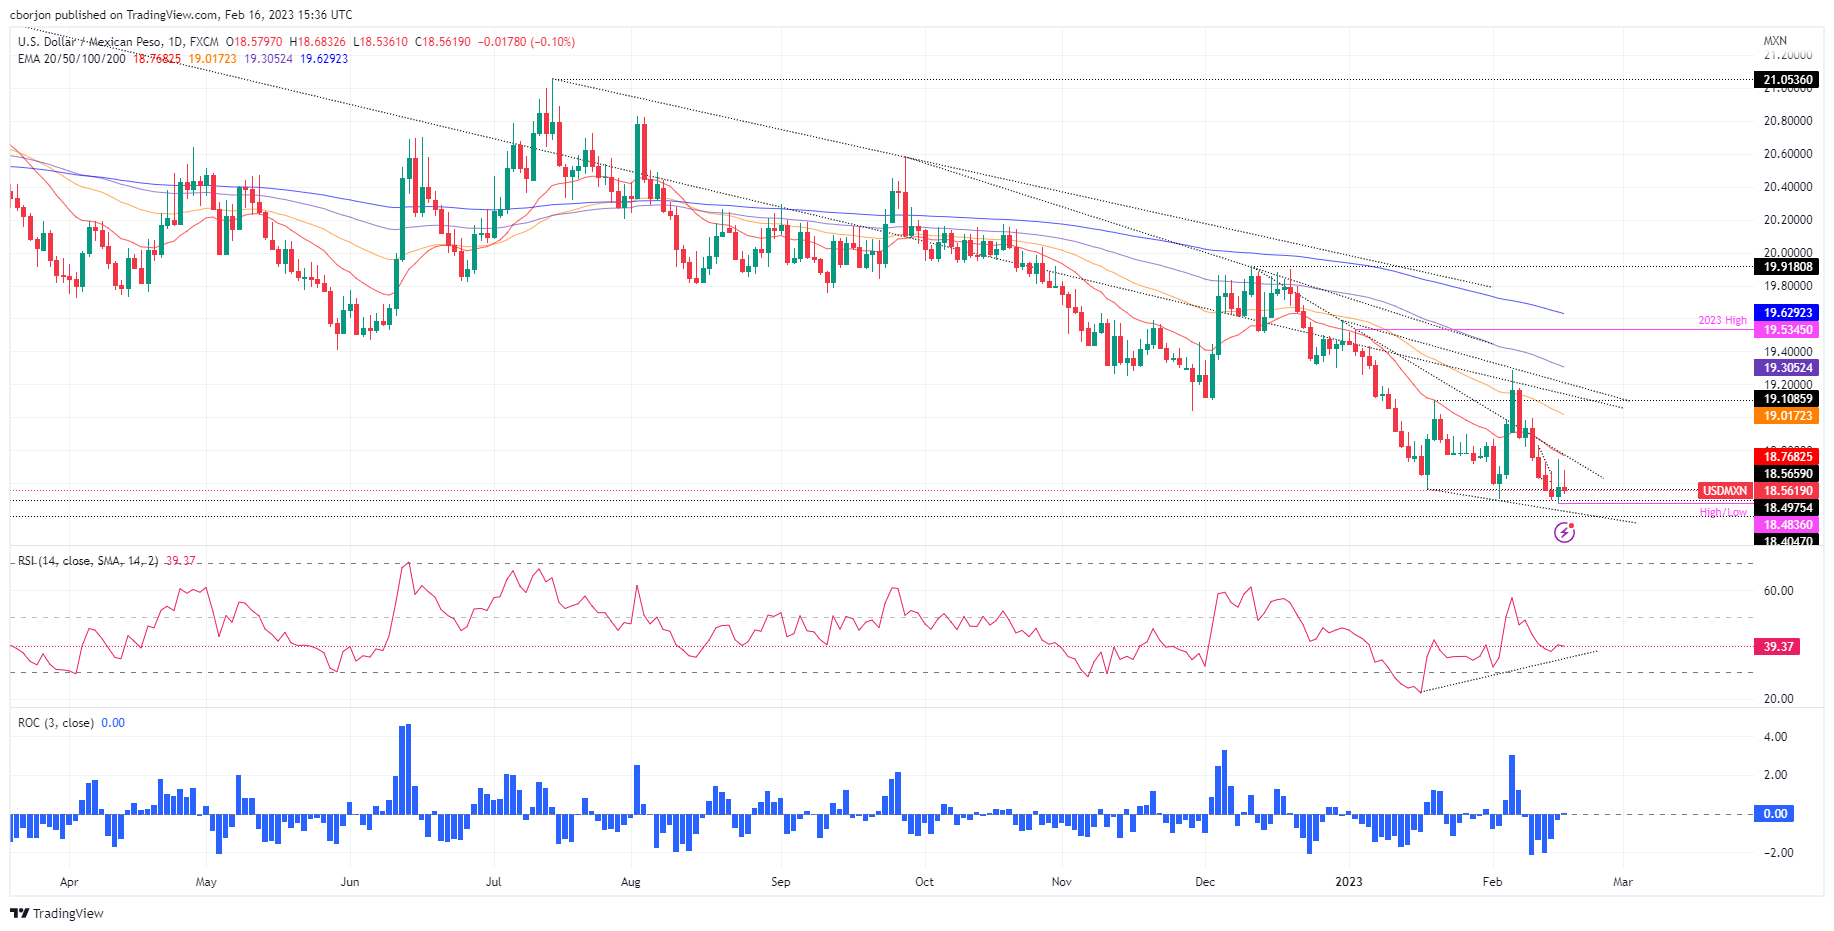
From a technical point of view, the USD/MXN maintains a neutral downward bias. However, the positive divergence between the Relative Strength Index (RSI) and the price action is looming, which means that prices could go higher. For a bearish continuation, USD/MXN needs to break below the yearly low at 18.4836, so it can test the key psychological level at $18.00. On the other hand, if USD/MXN recovers to the 20-day EMA at 18.7714, USD/MXN would be ready to challenge $19.00.
Source: Fx Street
I am Joshua Winder, a senior-level journalist and editor at World Stock Market. I specialize in covering news related to the stock market and economic trends. With more than 8 years of experience in this field, I have become an expert in financial reporting.


