
- USD/MXN is recovering some ground after falling to weekly lows of 18.8231.
- Despite the ongoing bullish correction, USD/MXN remains biased to the downside.
- USD/MXN: If it does not exceed 19.0000, the attempt to return to the lows of 18.50 could worsen.
The Mexican peso (MXN) It is losing ground against the US dollar (USD) after regaining some ground on Tuesday, following perceived “dovish” comments from US Federal Reserve (Fed) Chairman Jerome Powell. The USD/MXN pair fell from around 19.1783 towards weekly lows at 18.8691, but on Wednesday, the dollar is recovering. As of this writing, the USD/MXN is trading at 18.9475, up 0.17% on the day.
USD/MXN Price Analysis: Technical Perspective
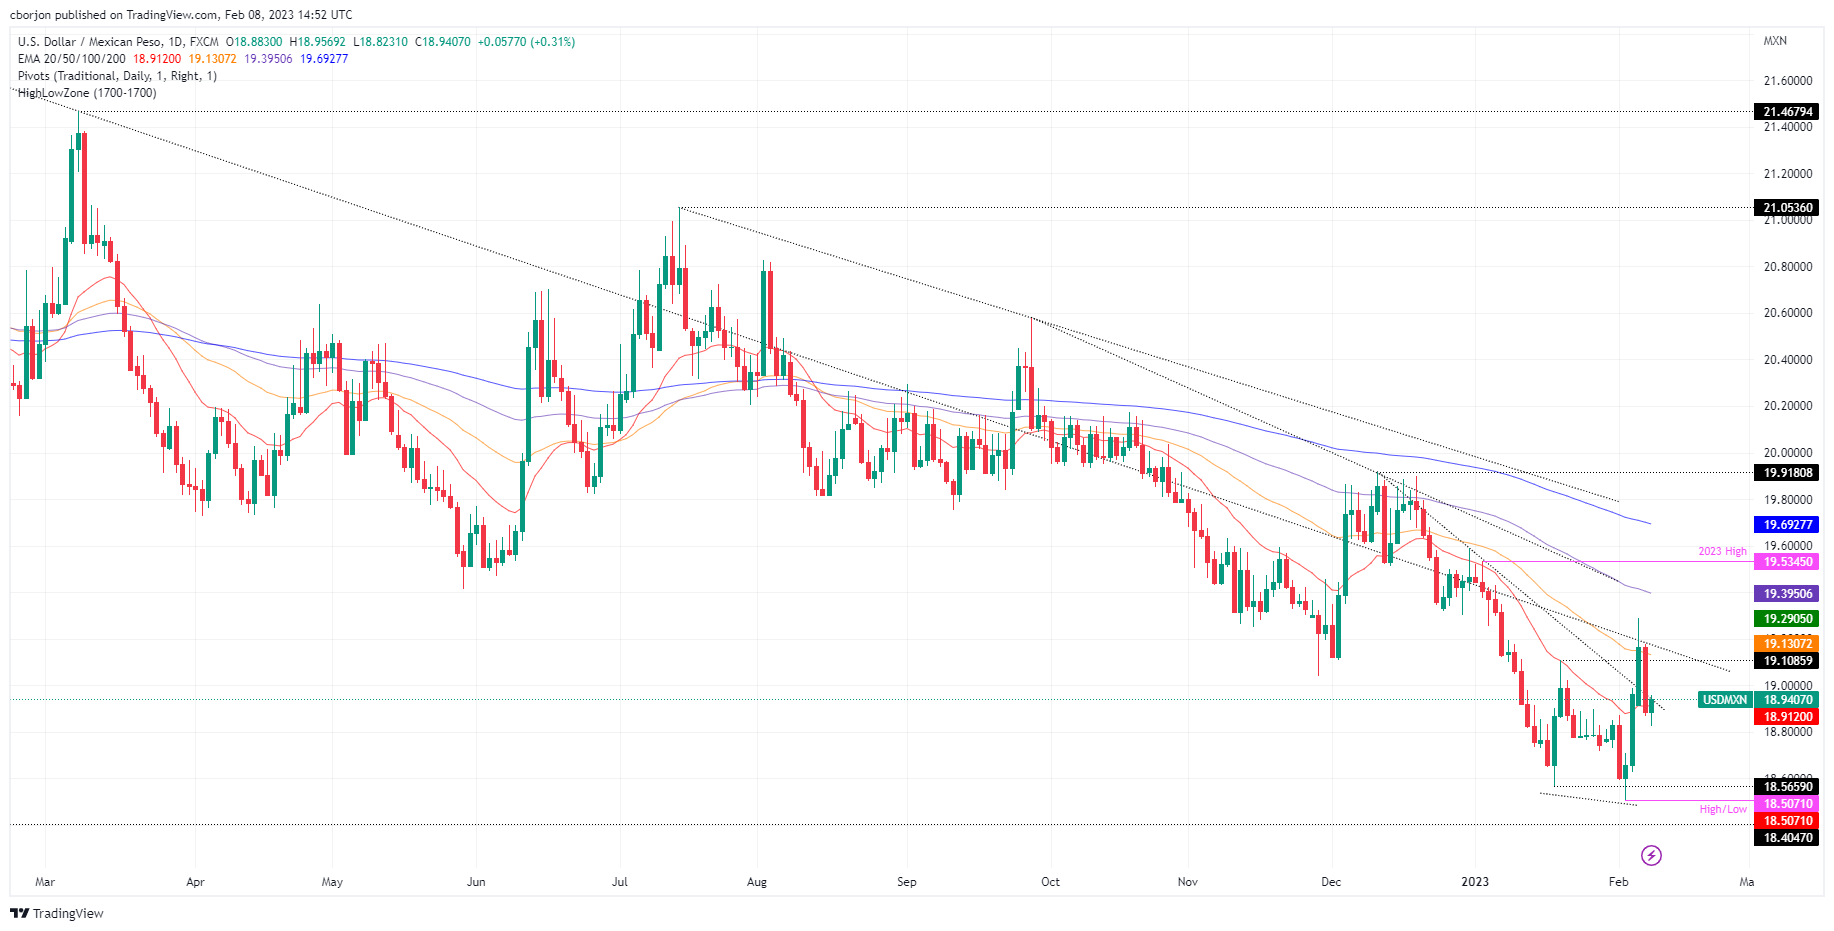
Before the Wall Street open, the USD/MXN pair was trading around the lows of the day, around 18.8231. However, a risk aversion boost increased demand for the US dollar, so USD/MXN is moving higher.
The USD/MXN daily chart suggests further declines are expected, but the ongoing correction could open the door for further gains. As of this writing, USD/MXN has broken the 20-day EMA at $18.9134 and could extend gains towards $19,000, psychological resistance. A break of the latter and USD/MXN could rally towards the January 19 daily high at 19.1085.
To resume the downtrend, the USD/MXN needs a break below the 20-day EMA at 18.9134. Once breached, critical support levels will be exposed. First, the February 7 low at 18.8691, followed by the daily low at 18.8231, and then the yearly low at 18.50.
Key USD/MXN Technical Levels
Source: Fx Street
I am Joshua Winder, a senior-level journalist and editor at World Stock Market. I specialize in covering news related to the stock market and economic trends. With more than 8 years of experience in this field, I have become an expert in financial reporting.


