
- USD/MXN falls as Banxico holds rates steady, despite global economic concerns.
- The Fed’s rate cut expectations cool down, improving the performance of the MXN against the USD.
- Economic activity in Mexico exceeds estimates, further driving the appreciation of the MXN.
He USD/MXN extends its losses towards last Friday’s daily low of 17.1308 after the Bank of Mexico’s (Banxico) monetary policy decision last Thursday to keep rates unchanged at 11.25%, its second pause after the May decision. The risk aversion momentum was no excuse for the Mexican Peso (MXN) to continue its strong advance against the US Dollar (USD). At the time of writing, the USD/MXN is trading at 17.1363, down 0.21%.
Banxico’s Stable Rates and Positive Economic Data Boost MXN; risk grips Wall Street
Wall Street is still trading negative. Risk aversion is the main driver of the markets in the midst of a light economic calendar in the United States (EU). The Dallas Fed Manufacturing Index for June contracted to -23.2, above estimates but still in recessionary territory, portraying an economic slowdown. Although it contracted, it was the one that improved the most in the last three months.
Meanwhile, market participants reduced their bets on a possible rate cut by the US Federal Reserve (Fed), as CME’s Fed Watch tool shows, after Fed officials reviewed the raises the federal funds rate (FFR) to 5.6%. However, money market futures do not believe the Fed will raise rates twice, with a single 25 basis point increase, towards the end of the year.
This helped the Mexican peso (MXN) to prolong its appreciation, despite events in Russia, with the private Russian group Wagner about to enter Moscow amid a disagreement with Russian commanders, which according to Yevgeny Prigozhin, leader of the group, botched Russia’s military campaign in Ukraine.
The US Dollar Index (DXY) tracks six currencies against the US dollar (USD), which fell 0.12% to 102.737, hurt by falling US Treasury yields.
Across the border, last week’s Banxico decision did not help USD/MXN buyers as the pair halted its rally and made a U-turn around 17.2644. The Mexican calendar on Monday showed that General Economic Activity for May rose 2.5%, beating estimates of 2.3%, according to Reuters. Meanwhile, month-on-month (m/m) readings rose 0.8%, surpassing March’s contraction of -0.2%.
USD/MXN Price Analysis: Technical Perspective
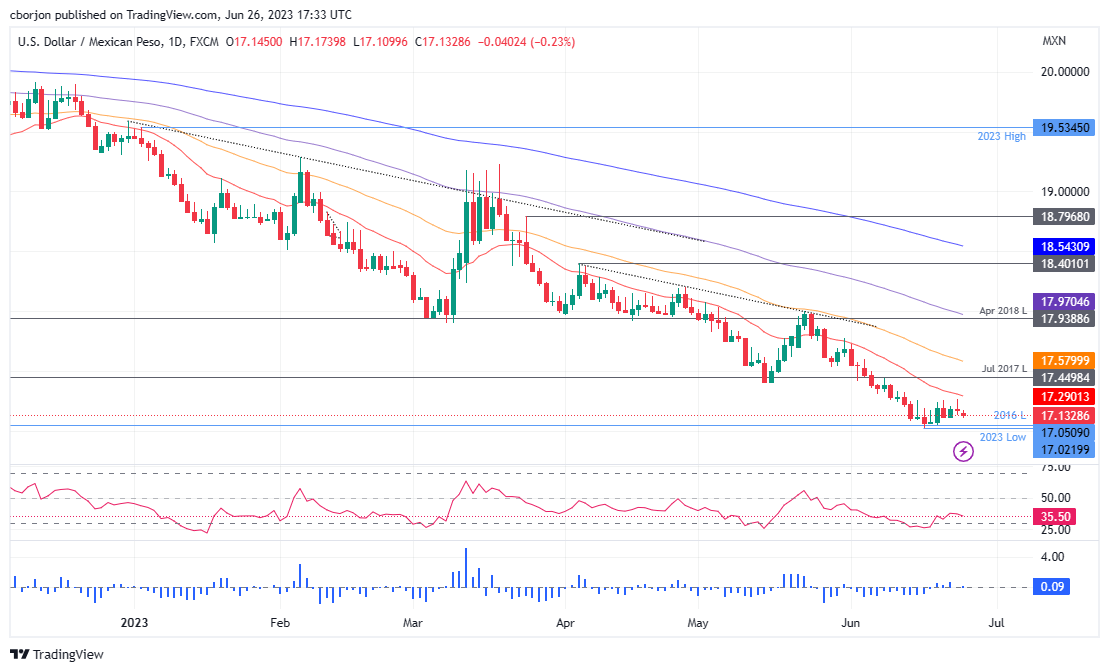
USD/MXN has a bearish bias and will continue falling around the 17.00 area. As the 20 day EMA broke out around 17.2897, expect further continuation below 17.1000. A break of the latter would expose the year to date low of 17.0219 before breaking above the 17.00 area. On the other hand, if the USD/MXN buyers reach the 20-day EMA, the USD/MXN could rally, at least as far as the 50-day EMA at 17.5799.
Source: Fx Street
I am Joshua Winder, a senior-level journalist and editor at World Stock Market. I specialize in covering news related to the stock market and economic trends. With more than 8 years of experience in this field, I have become an expert in financial reporting.


