
- USD/MXN is trading at 16.7508, down 0.26%, as disappointing US GDP and jobs data weaken the Dollar, putting downward pressure on US Treasury yields.
- The US Dollar Index (DXY) is down more than 1% to 103.133, amplifying USD/MXN losses against a background of general Dollar weakness.
He Mexican Peso (MXN) strengthened against US dollar (USD) on Wednesday, after learning that the United States (US) economy is declining, according to the latest employment and growth data. Therefore, US Treasury yields fell, a headwind for the dollar. The USD/MXN pair is trading at 16.7508, shedding 0.26% after hitting a high of 16.8029.
The Mexican Peso benefits from weak US GDP jobs data, while the stability of Mexican monetary policy improves its outlook
Upbeat market sentiment boosts appetite for the emerging market currency, as reflected by the rise in US stocks. The dollar falls after the US Department of Commerce revised downward the Gross Domestic Product (GDP) for the second quarter from 2.4% to 2.1%. Although the figures exceed the data for the first quarter, the economy is stagnating, as the labor market data for the current week had shown.
In this sense, private hiring slowed down, as reported by ADP in its national employment report, which reported that private companies added only 177,000 jobs, below estimates of 195,000. This, coupled with a weaker weekly jobs report, paints a not-so-good scenario for Friday’s US Nonfarm Payrolls report.
Treasury yields fell, weighing on the dollar. The Dollar Index (DXY), which measures the value of the dollar against a basket of six currencies, fell more than 1% to 103,133. Therefore, the USD/MXN extended its losses amid the general weakness of the Dollar.
Across the border, José Pérez, head of Emerging Markets Research at S&P Global, said he does not expect significant changes in Mexico’s credit profile in 2024. Pérez added that he expects Mexico’s monetary policy to remain stable, and rates could begin to decline in early 2024.
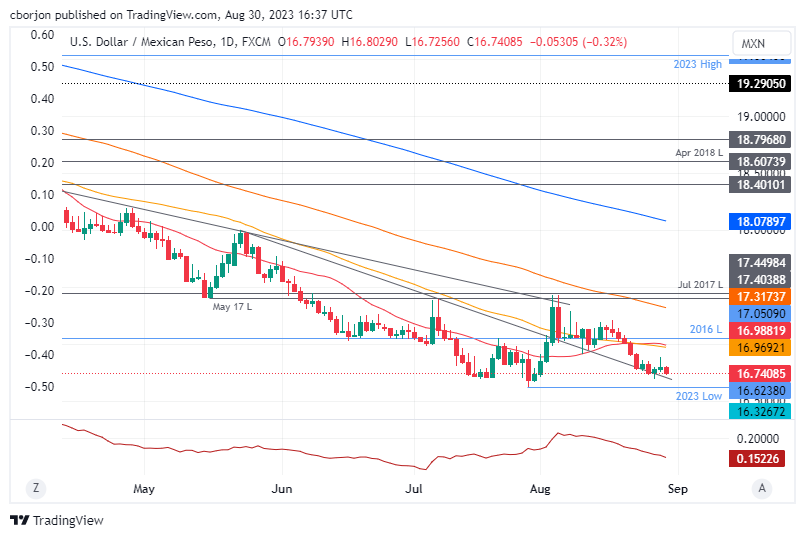
That said, given Banco de México’s (Banxico) forecasts of a longer rally, the USD/MXN outlook is likely to remain skewed to the downside, but the lack of a stronger catalyst keeps the pair above. from the low of 16.6238.
USD/MXN Price Analysis: Technical Perspective
From a technical point of view, the USD/MXN has consolidated around 16.6900/16.8900 during the week, as the 50 and 20-day moving averages (DMA) moved flat at 16.9694 and 16.9886, respectively, which suggests that the pair is waiting for a new catalyst. Downside risks emerge at the weekly low of 16.6923, exposing the year-to-date low of 16.6238. Otherwise, if USD/MXN breaks above the weekly high, the 50 DMA at 16.9694 would be in play.
Source: Fx Street
I am Joshua Winder, a senior-level journalist and editor at World Stock Market. I specialize in covering news related to the stock market and economic trends. With more than 8 years of experience in this field, I have become an expert in financial reporting.


")

