
- Banxico leaves interest rates unchanged at 11.25%, ending the cycle of increases that began in June 2021, causing a moderate reaction in the USD/MXN.
- Banxico’s statement indicates a disinflationary process underway, although it acknowledges a complicated and uncertain inflationary outlook with potential upward risks.
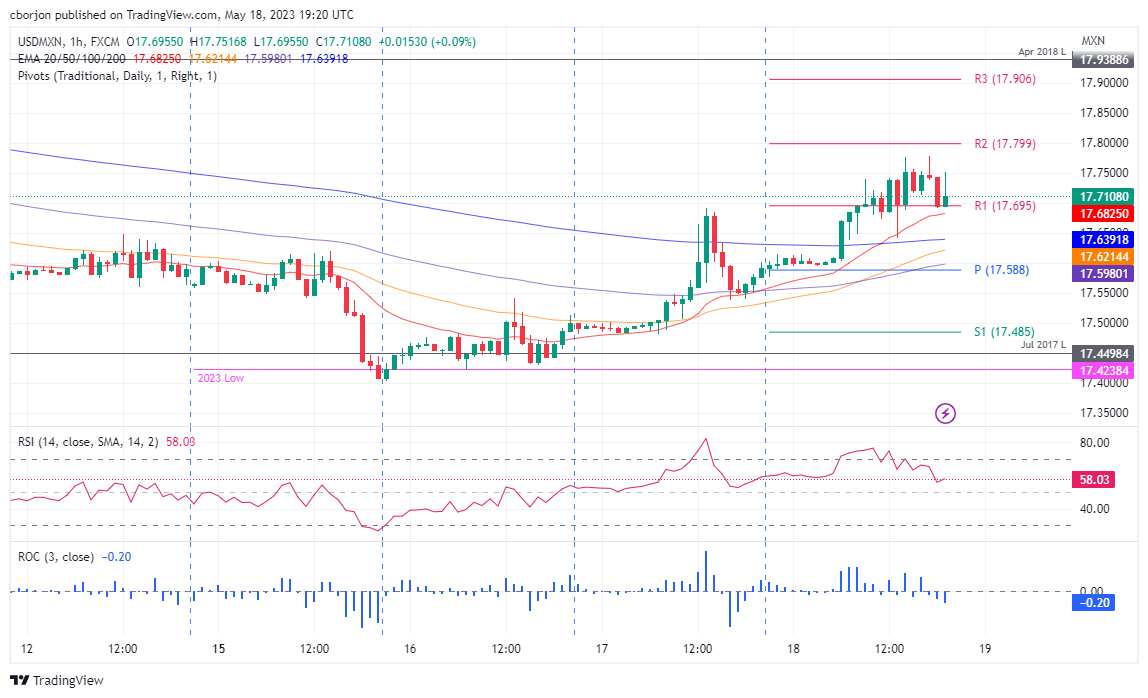
- The USD/MXN exchange rate experiences limited reaction, holding position above the 17.7000 figure, with the 18.0000 level in sight as the next key resistance.
the mexican peso (MXN) it depreciates sharply after the decision of the Bank of Mexico (Banxico) to keep rates unchanged at 11.25%, ending its cycle of increases in June 2021 after 700 basis points of increases. At time of writing, USD/MXN is trading volatilely around the 17.70000 – 17.7500 zone, with US dollar (USD) buyers keeping an eye on the 18,000 psychological barrier.
Summary of Banxico’s monetary policy statement
The Bank of Mexico based its decision despite the fact that underlying inflation has shown some resistance to lowering, but commented that several central banks stopped their reference rates. Banxico assessed global economic growth as trending downward, but commented that inflation in Mexico has fallen since the last policy meeting, noting that core inflation fell more “markedly than in previous months.”
The Governing Board evaluated the magnitude and diversity of the inflationary shocks and considered that the economy has begun to experience a disinflationary process, given that many pressures have eased. The Board will monitor inflationary pressures and “estimates that inflationary prospects will be difficult and uncertain throughout the forecast horizon, with upside risks.”
The Governing Board ended the statement stating that it will maintain the reference rate at its current level for a long period of time.
USD/MXN reaction
USD/MXN’s reaction was subdued, with the exchange rate holding above 17.7000 after colliding with the 20-day EMA at 17.7682 earlier in the day, limiting USD/MXN’s rally. Above that level comes the psychological figure of 18.0000, ahead of the 50 day EMA at 18.0332.
To the downside, any drop below the May 17 high at 17.6914 could open the door for a retest of lower levels around 17.6000, followed by July 2017 lows at 17.4500.
Source: Fx Street
I am Joshua Winder, a senior-level journalist and editor at World Stock Market. I specialize in covering news related to the stock market and economic trends. With more than 8 years of experience in this field, I have become an expert in financial reporting.


