
- USD/MXN falls to seven-year lows, extending losses for a fourth consecutive week.
- The Federal Reserve’s decision to hold rates on hold weakens the US dollar, further fueling USD/MXN losses.
- Aggressively, Fed officials hint at further tightening if inflation doesn’t slow.
- Comments from Banxico officials suggest a possible rate cut in November, in conflict with the views of Governor Victoria Rodríguez Ceja.
He Mexican Peso (MXN) It posted a new seven-year high against the US dollar (USD), while the USD/MXN pair fell to 17.0360, extending its losses to four consecutive weeks. The Federal Reserve’s (Fed) decision to keep interest rates unchanged weakened the dollar, a headwind for USD/MXN, which continued to slide amid risk aversion momentum. At the time of writing these lines, the USD/MXN is trading at 17.0449.
Comments from Banxico officials in the spotlight, US consumer sentiment rises as inflation expectations moderate
Wall Street turned negative due to the OpEx triple witch, with nearly 4.2 trillion options set to expire. However, amid hawkish comments from the Fed, the risk-sensitive Mexican peso maintained its weekly and daily gains that followed the Fed’s decision.
US data showed that inflation is cooling, but not at the rate the US central bank would like. However, they did not pull the trigger and would wait for the July meeting to carry out the first of two 25 basis point rate hikes discounted by investors, who expect the first rate cut in early 2024.
This propelled USD/MXN to new 7-year lows over the past two days, despite Fed policymakers raising maximum rates, above the 5.50% threshold.
On Friday, the US Agenda revealed that US May Consumer Sentiment rose to 68.0 above the final May reading of 64.9. The same survey by the University of Michigan (UM) showed that one-year inflation expectations fell from 4.2% to 3.3% in June.
Meanwhile, US central bank officials hawkishly crossed the wires, though they failed to prop up USD/MXN. Richmond Fed President Thomas Barkin said he wants to do “more” if inflation doesn’t slow. Fed Governor Christopher Waller added that slow inflation “will probably require some more tightening.”
On the Mexican front, the lack of economic data was no excuse for the MXN to continue to gain strength against the dollar. Comments by Banco de México (Banxico) deputy governor Jonathan Heath opened the door for the first rate cut by the Mexican central bank in November. Contrary to her point of view, the governor of Banxico, Victoria Rodríguez Ceja, commented that the rates would remain unchanged at the current bank rate of 11.25% for at least two meetings. However, she did not open the door to easing the policy.
upcoming events
In the US, the Fed’s statements will grab most of the headlines, along with the release of housing sector data and the S&P Global PMIs. On the Mexican front, the calendar will show retail sales ahead of Banxico’s monetary policy decision.
USD/MXN Price Analysis: Technical Perspective
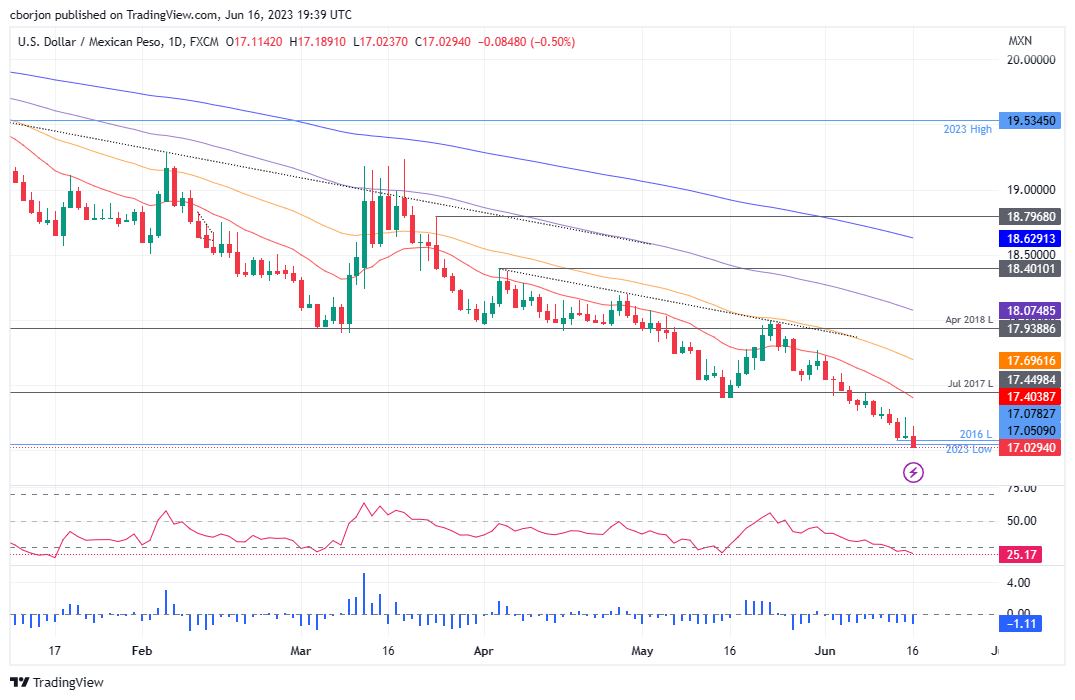
USD/MXN extended its slide past the 2016 low of 17.0509, about to challenge the 17.0000 figure. Despite oscillators remaining in overbought conditions, with the RSI below 30, the three-day RoC rate suggests some selling pressure to come. However, if it fails to break above 17.0000, sellers could be put under pressure by Banxico’s imminent monetary policy decision.
However, the path of least resistance in the short term is to the downside. The next stop for the USD/MXN would be 17.0000. If USD/MXN dips below that level, the psychological level of 16.50 would be next, before testing the October 2015 low of 16.3267. Conversely, risks to the USD/MXN to the upside are at the confluence of the May 15 low and the 20-day EMA at 17.4038/42, followed by the 50-day EMA at 17.6963.
Source: Fx Street
I am Joshua Winder, a senior-level journalist and editor at World Stock Market. I specialize in covering news related to the stock market and economic trends. With more than 8 years of experience in this field, I have become an expert in financial reporting.


