
- USD/JPY might have developed an Expanding Formation price pattern.
- If so, it could have bearish reversal potential and see prices fall substantially lower.
USD/JPY could still be in the process of forming an Expanding Formation pattern with bearish potential. If so, it is likely to eventually decline towards the pattern’s lower boundary line at around 151.50. After that, it could even break below that line and decline towards the projected target for the Expanding Formation (EF), at around 148.54.
USD/JPY 4-hour chart
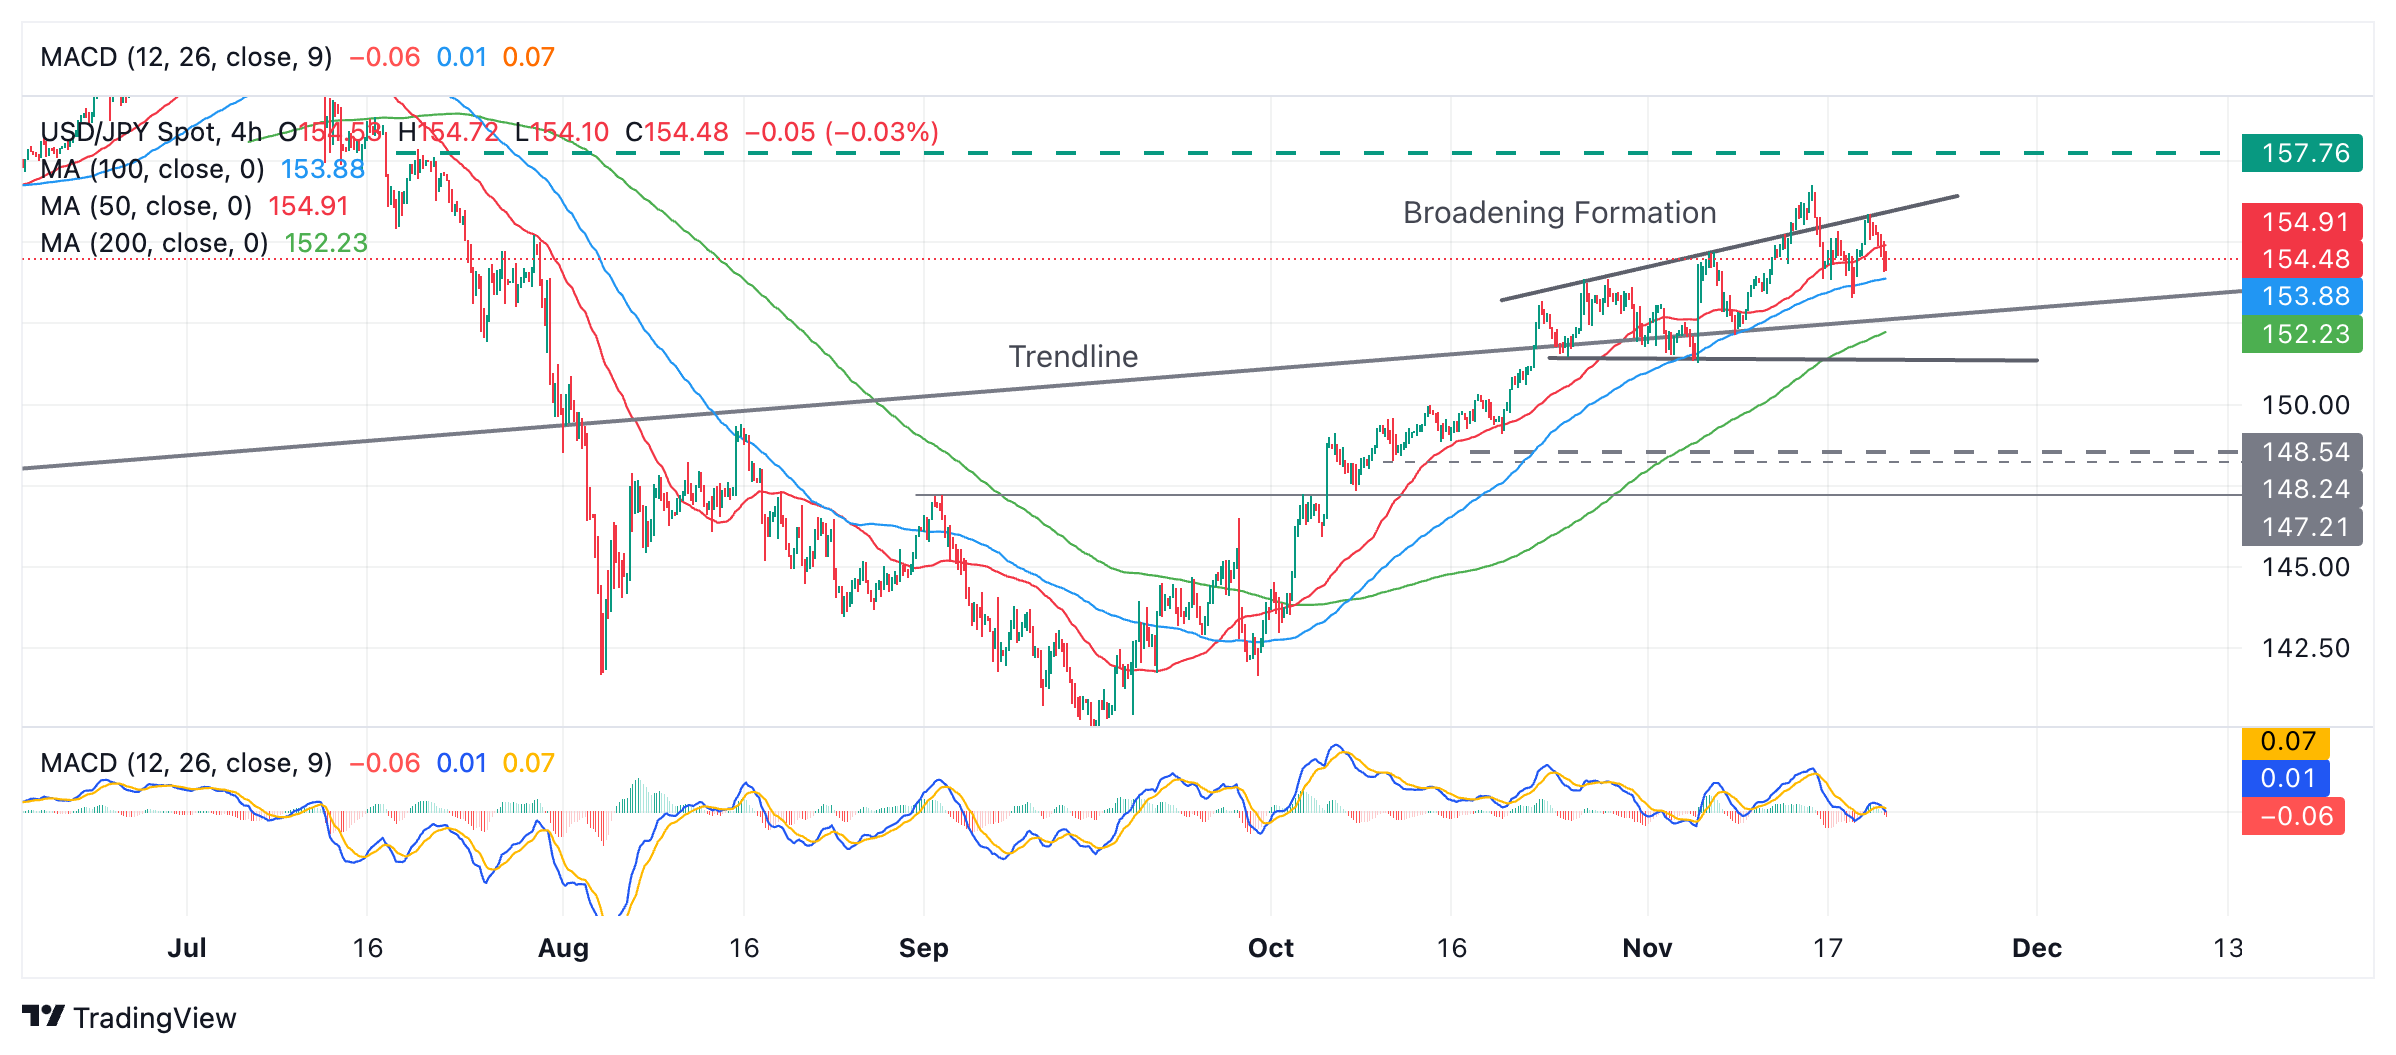
USD/JPY has broken above the FE upper limit line and this could be a sign of exhaustion of the uptrend or a sign of optimism.
It is possible that the pattern is false and in that case, USD/JPY would still be in a strong medium-term uptrend. If so, given the technical analysis principle that “the trend is your friend”, the odds would favor further upside.
In such a case, a break above 156.25 would likely confirm further gains towards a target around 157.86 (July 19 high).
Source: Fx Street
I am Joshua Winder, a senior-level journalist and editor at World Stock Market. I specialize in covering news related to the stock market and economic trends. With more than 8 years of experience in this field, I have become an expert in financial reporting.
.jpg "The Roman holidays of JD Vance: between hugs with Giorgia Meloni and meetings (missed) with Pope Francis")


