
- The USD/JPY pair extends its losses on talks surrounding the Japanese government’s stimulus measures.
- Momentum indicators suggest a favorable trend in the pair’s movement in the near term.
- The psychological level of 147.50 acts as immediate resistance, in line with the weekly high.
The USD/JPY pair extended its losses for the second day in a row, trading around 147.40 below the yearly highs reached during the European session on Thursday. The pair experienced bearish pressures following dovish economic data from the United States (US).
In addition, according to Kyodo News, citing anonymous sources, the Japanese government is planning to introduce new economic stimulus measures in October. The main objectives of these stimulus measures, as mentioned in the news, are to provide support to companies to increase wages and reduce energy costs.
The moving average convergence divergence (MACD) line remains above the center line and sits above the signal line. This suggests that the recent momentum is relatively stronger.
The psychological level of 147.50 acts as an immediate barrier, followed by the weekly high at 147.87. Breaking above this last level could support the USD/JPY pair to explore the region around the 148.00 level.
To the downside, the 14-day EMA at 146.37 is shaping up to be key support, following the 21-day EMA at 145.81 aligned with the 23.6% Fibonacci retracement at the 145.37 level.
In the short term, the USD/JPY pair remains bullish as long as the 14-day RSI remains above 50.
USD/JPY: Daily Chart
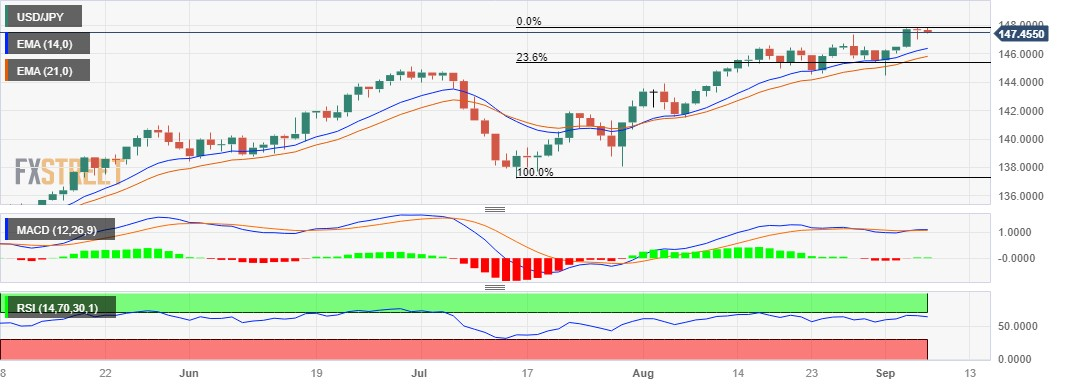
Source: Fx Street
I am Joshua Winder, a senior-level journalist and editor at World Stock Market. I specialize in covering news related to the stock market and economic trends. With more than 8 years of experience in this field, I have become an expert in financial reporting.


