
- The USD/JPY extends its upward trend to 154.00 points.
- It could be forming a measured movement pattern with a final target at 156.11.
- However, the RSI is overbought, so a correction could be on the horizon.
The USD/JPY pair is trading in the high zone of 154.00. What appears to be a measured moving price pattern composed of three waves, commonly labeled A, B, and C, has formed.
In the case of measured movements, the end of wave C can be reliably predicted, as it is often at the point where wave C is equal in length to wave A, or a Fibonacci ratio of wave A At a minimum, wave C typically extends to a ratio of 0.618 of A.
USD/JPY Daily Chart
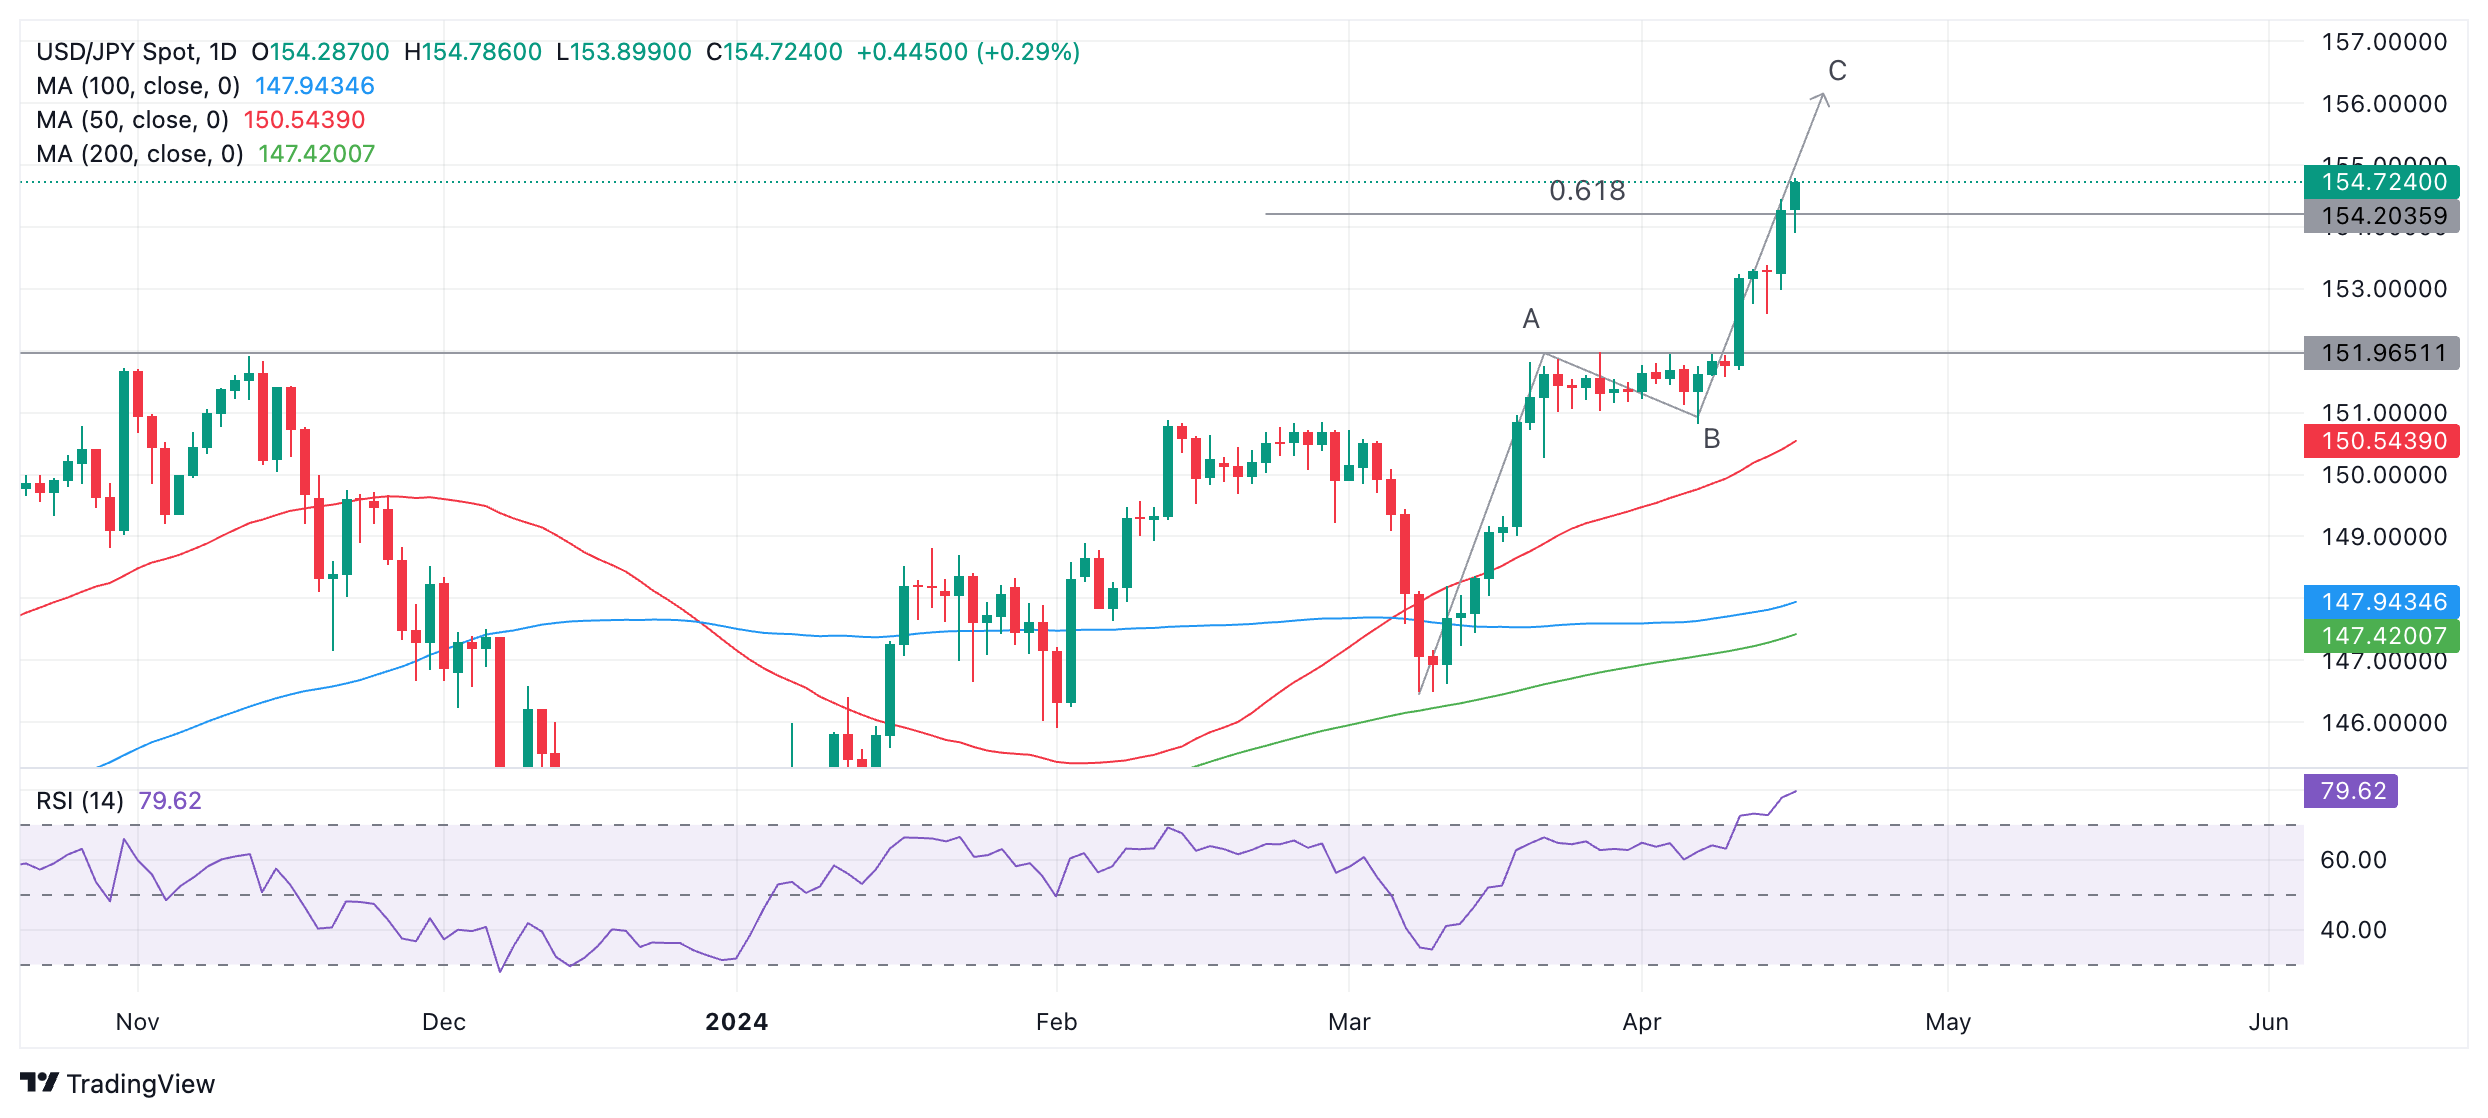
The end of wave C, if it ends the same as wave A, will reach around 156.11 and there is a possibility that the rally could extend to that level.
However, it is also the case that the price has already reached the conservative target for the end of wave C at the 0.618% Fibonacci of wave A, at 154.20, which means there is a possibility that it has broken out to its limit.
Furthermore, the Relative Strength Index (RSI) is in the overbought zone, so bullish traders with a medium-term vision should not increase their long bets. If the RSI breaks out of overbought it may be a sign that the USD/JPY is retreating.
For USD/JPY bulls the important thing is that the price itself continues to rise and as long as it does so the bullish trend is likely to continue.
Source: Fx Street
I am Joshua Winder, a senior-level journalist and editor at World Stock Market. I specialize in covering news related to the stock market and economic trends. With more than 8 years of experience in this field, I have become an expert in financial reporting.


