
- USD/JPY stumbles below 144.00 on falling US bond yields.
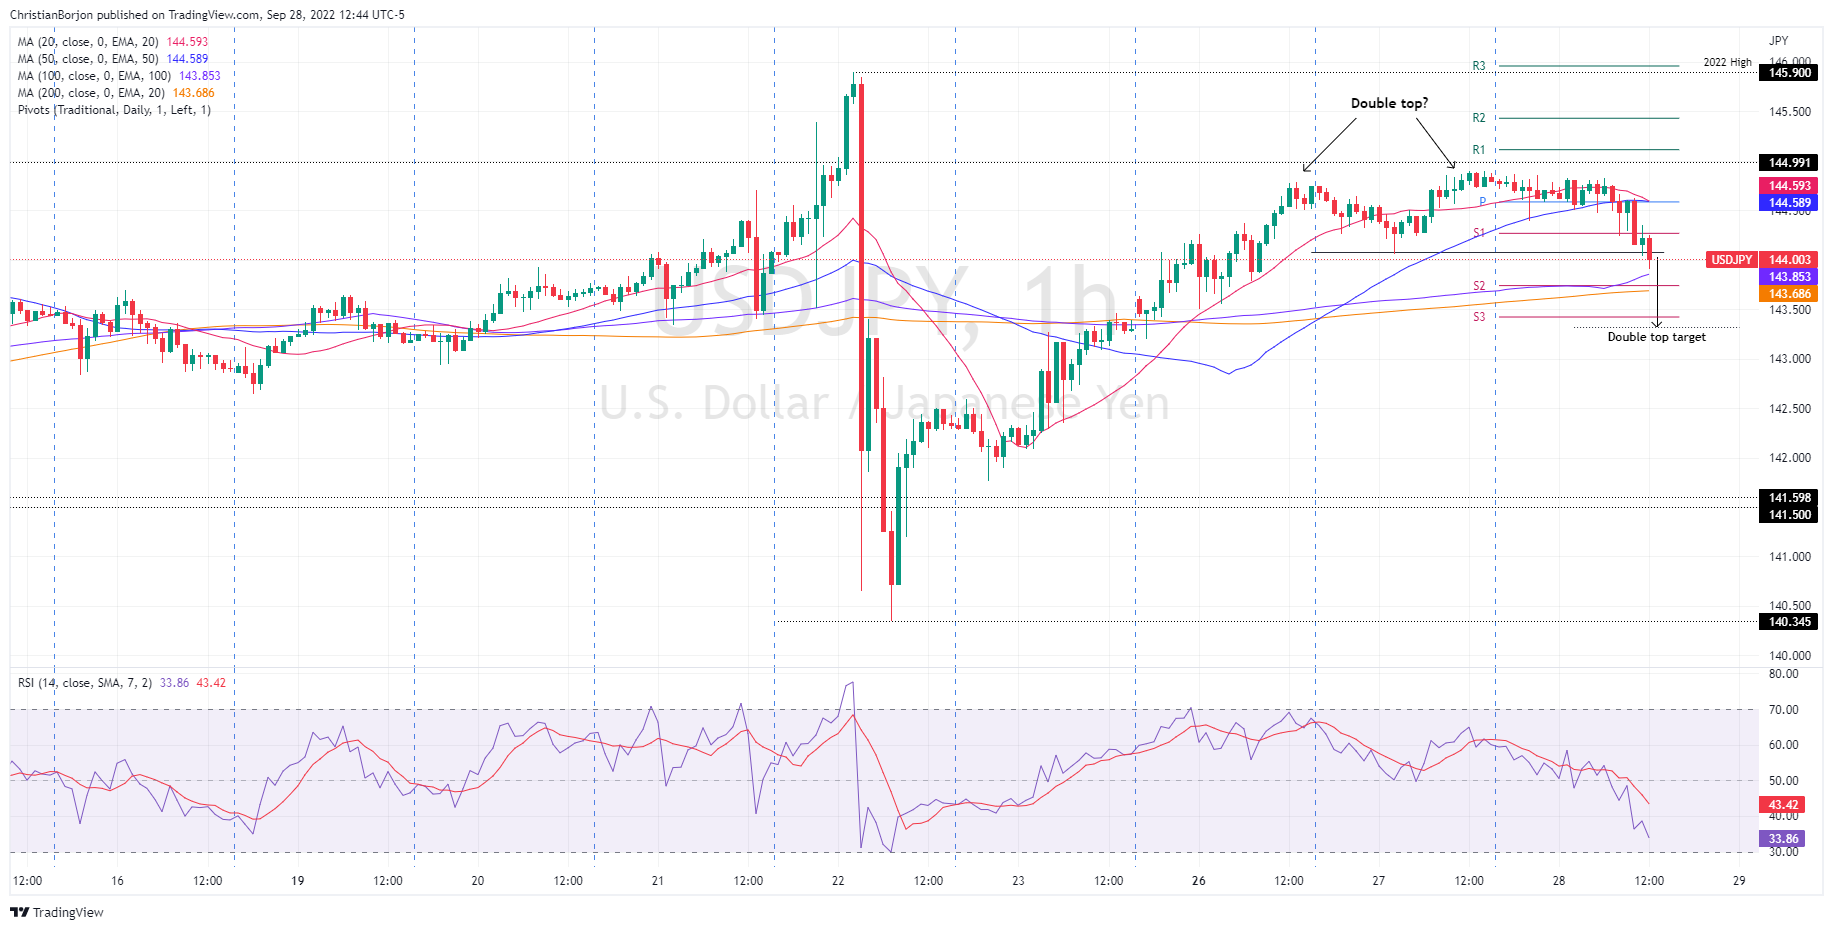
- A triple top on the USD/JPY one hour chart put downward pressure on the pair, which broke above the 20 and 50 EMAs.
- USD/JPY triple top points to a drop to 143.30.
The USD/JPY falls from weekly highs around 144.90 due to improving market sentiment and also falling US bond yields, with the 10-year Treasury yield falling 23 basis points, from around 4.01% to 3.73%. At the time of writing, USD/JPY is trading at 143.99, down 0.57% from its opening price.
USD/JPY Price Analysis: Technical Outlook
The USD/JPY daily chart shows the pair in a neutral-bearish bias once Tuesday’s price action printed a doji. Notably, the Relative Strength Index (RSI) continues to push lower as price action is below the daily low of 27 Sep at 144.05, exacerbating a drop towards the 143.00 figure and beyond.
In yesterday’s article, “is emerging a Patterndouble top chart around 144.60-75 area, which could pave the way for further losses. However, the EMAs of20 and 50 dayswhich meanders around 144.51 and 144.16, respectively, would be hard to beatIt should be noted that USD/JPY initially approached the weekly high, forming a “triple top” rather than a “double top”, and dipped below the 20 and 50-day EMAs, accelerating the decline in USD/JPY below the 144.00 signal.
Therefore, the first support for USD/JPY would be the 50-day EMA at 143.85, immediately followed by the S2 daily pivot at 143.74, ahead of the 200-EMA at 143.68. A break below will expose the S3 pivot point at 143.42 and the triple top target at 143.30.
Key USD/JPY Technical Levels
Source: Fx Street
With 6 years of experience, I bring to the table captivating and informative writing in the world news category. My expertise covers a range of industries, including tourism, technology, forex and stocks. From brief social media posts to in-depth articles, I am dedicated to creating compelling content for various platforms.


