
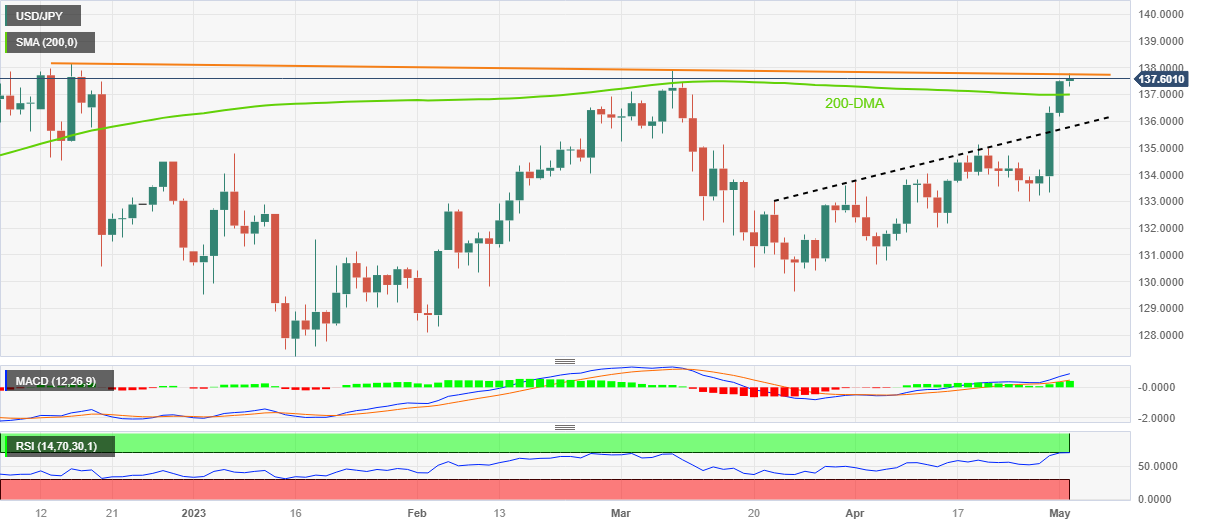
- USD/JPY rises to two-month highs and strings four days of gains.
- The mid-December 2022 resistance line and the overbought RSI (14) could stop buyers of the pair.
- Sellers need validation from the 200-day SMA and the previous resistance line from late March.
USD/JPY bulls appear to run out of steam at the highest levels in two months, holding steady around the 137.70-137.60 region at the start of the European session on Tuesday.
The pair fails to break above a downtrend line from December 2022, near 137.80, amid overbought conditions of the RSI (14).
Even if the pair manages to clear the aforementioned hurdle, a rally above the 138.00 round level is necessary to restore market confidence in the bulls.
Higher up, the late-2022 high near 138.20 and the round level of 140.00 may act as the last defenses for USD/JPY bears before relinquishing control to the buyers.
On the other hand, moves to the downside need to break the support of the 200-day SMA at 136.95 by daily close to convince USD/JPY sellers. Still, the previous resistance line from late March around 135.75 joins the bullish signals from the MACD to challenge the pair’s bears.
Should USD/JPY close below the resistance-turned-support now of 135.75, further falls cannot be ruled out.
In short, USD/JPY remains bullish even if the buying momentum seems elusive recently.
USD/JPY daily chart
Trend: Expected setback
Source: Fx Street
I am Joshua Winder, a senior-level journalist and editor at World Stock Market. I specialize in covering news related to the stock market and economic trends. With more than 8 years of experience in this field, I have become an expert in financial reporting.


