
- USD/JPY moves below the psychological level of 141.00 due to weakness in the US Dollar.
- Technical indicators suggest bearish sentiment to test the main support at 140.50.
- A break above the 142.00 level could lead the pair to reach the nine-day EMA at 142.41.
USD/JPY extends its losses, while the US Dollar (USD) weakens on the Federal Reserve's (Fed) dovish outlook for the first quarter of 2024. USD/JPY trades lower around 140.80 during the early hours of Thursday's European session. The psychological level of 141.00 is emerging as immediate resistance after the next barrier at the 142.00 level.
Breaking above the psychological level would support USD/JPY to reach the nine-day EMA at 142.41, following the psychological resistance at the 143.00 level. If the pair successfully breaks this level, the next barrier would be the 23.6% Fibonacci retracement level at 143.35.
The 14-day Relative Strength Index (RSI) below the 50 level indicates weaker sentiment for USD/JPY. Furthermore, the Moving Average Convergence Divergence (MACD) line is located below the center line and the signal line, indicating bearish momentum in the market for USD/JPY.
The bearish sentiment could push USD/JPY towards the main support zone around 140.50. If there is a decisive break below this level, the pair could test the psychological level at 140.00.
USD/JPY: Daily Chart
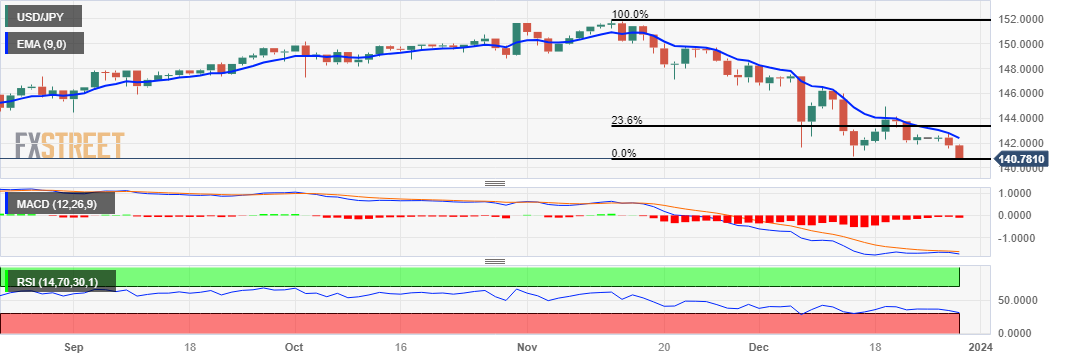
Source: Fx Street
I am Joshua Winder, a senior-level journalist and editor at World Stock Market. I specialize in covering news related to the stock market and economic trends. With more than 8 years of experience in this field, I have become an expert in financial reporting.


