
- USD/JPY advances although it struggles for resistance at 134.00.
- US Treasury bond yields pull back from daily highs, capping USD/JPY’s upside move.
- USD/JPY has a short-term bullish bias, but a break above the 200 hourly EMA is needed to pave the way towards 136.50.
The USD/JPY advances strongly during the North American session, underpinned by the high yields of US Treasuries, which rise 0.66% in a day with an upbeat sentiment, courtesy of the Speaker of the US House of Representatives US Pelosi leaving Taiwan, while US stocks remain positive, buoyed by corporate earnings. At the time of writing, the USD/JPY is trading at 133.95.
USD/JPY Price Analysis: Technical Outlook
USD/JPY has a neutral-bullish bias but is facing strong resistance at 134.57, the 50-day EMA. Although the buyers regained control, the Relative Strength Index (RSI) remains in negative territory, which means that the sellers lost steam and could re-enter with confidence. Even so, they will need a daily close below 134.00 to maintain hope for lower prices.
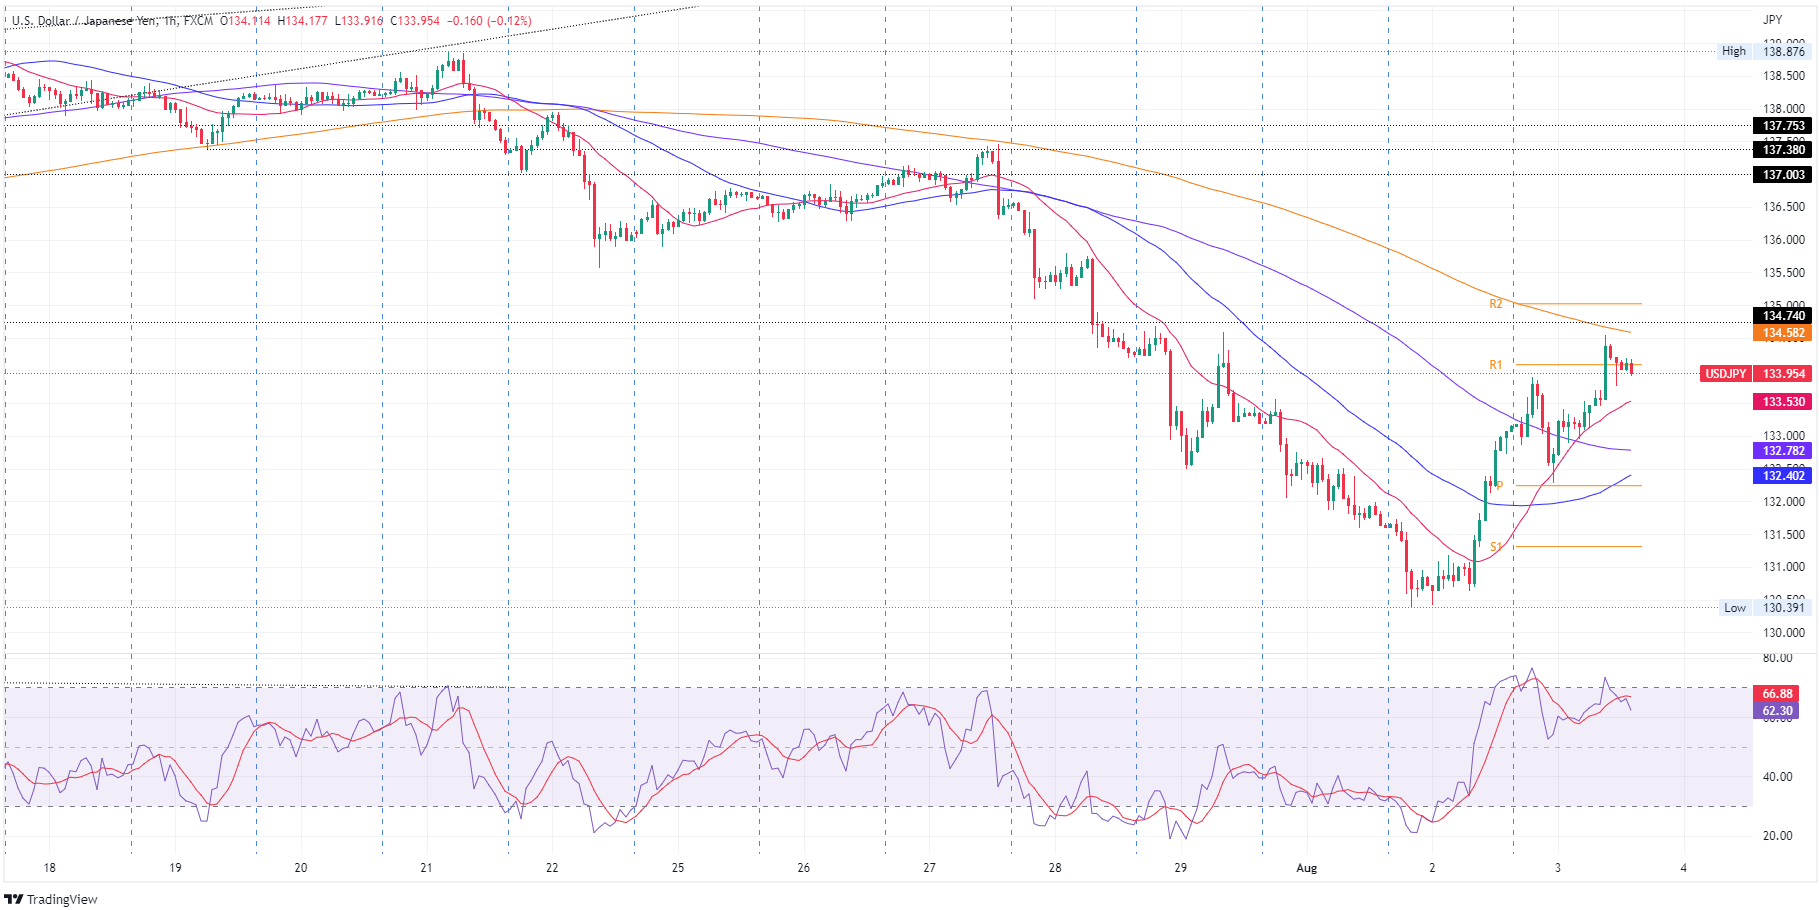
USD/JPY 1 hour chart
On the hourly chart, USD/JPY has a neutral to bullish bias. The hourly EMAs are below the exchange rate, except for the 200 hour EMA at 134.58, which would be a tough resistance to break. However, the price action over the past two days, breaking the daily high of Aug 1 at 133.56, exacerbated the rally towards weekly highs at 134.54. That said, short-term USD/JPY is heading higher.
Therefore, the first resistance for USD/JPY would be the 200 hourly EMA around 134.58. If it breaks above, the R2 daily pivot at 135.00 will be exposed, followed by the daily high of 27 Jul at 136.57. On the other hand, the first support for the USD/JPY would be the 20-hour EMA at 133.53. The breakout of the latter will expose the 100 hourly EMA at 132.78, followed by the 50 hourly EMA at 132.40.
USD/JPY Price Analysis
Source: Fx Street
With 6 years of experience, I bring to the table captivating and informative writing in the world news category. My expertise covers a range of industries, including tourism, technology, forex and stocks. From brief social media posts to in-depth articles, I am dedicated to creating compelling content for various platforms.


