
- USD/JPY continues to be supported by the 10-year US Treasury yield and market sentiment.
- The latest US inflation data triggered a rally in USD/JPY last week from 131.50 to 135.00.
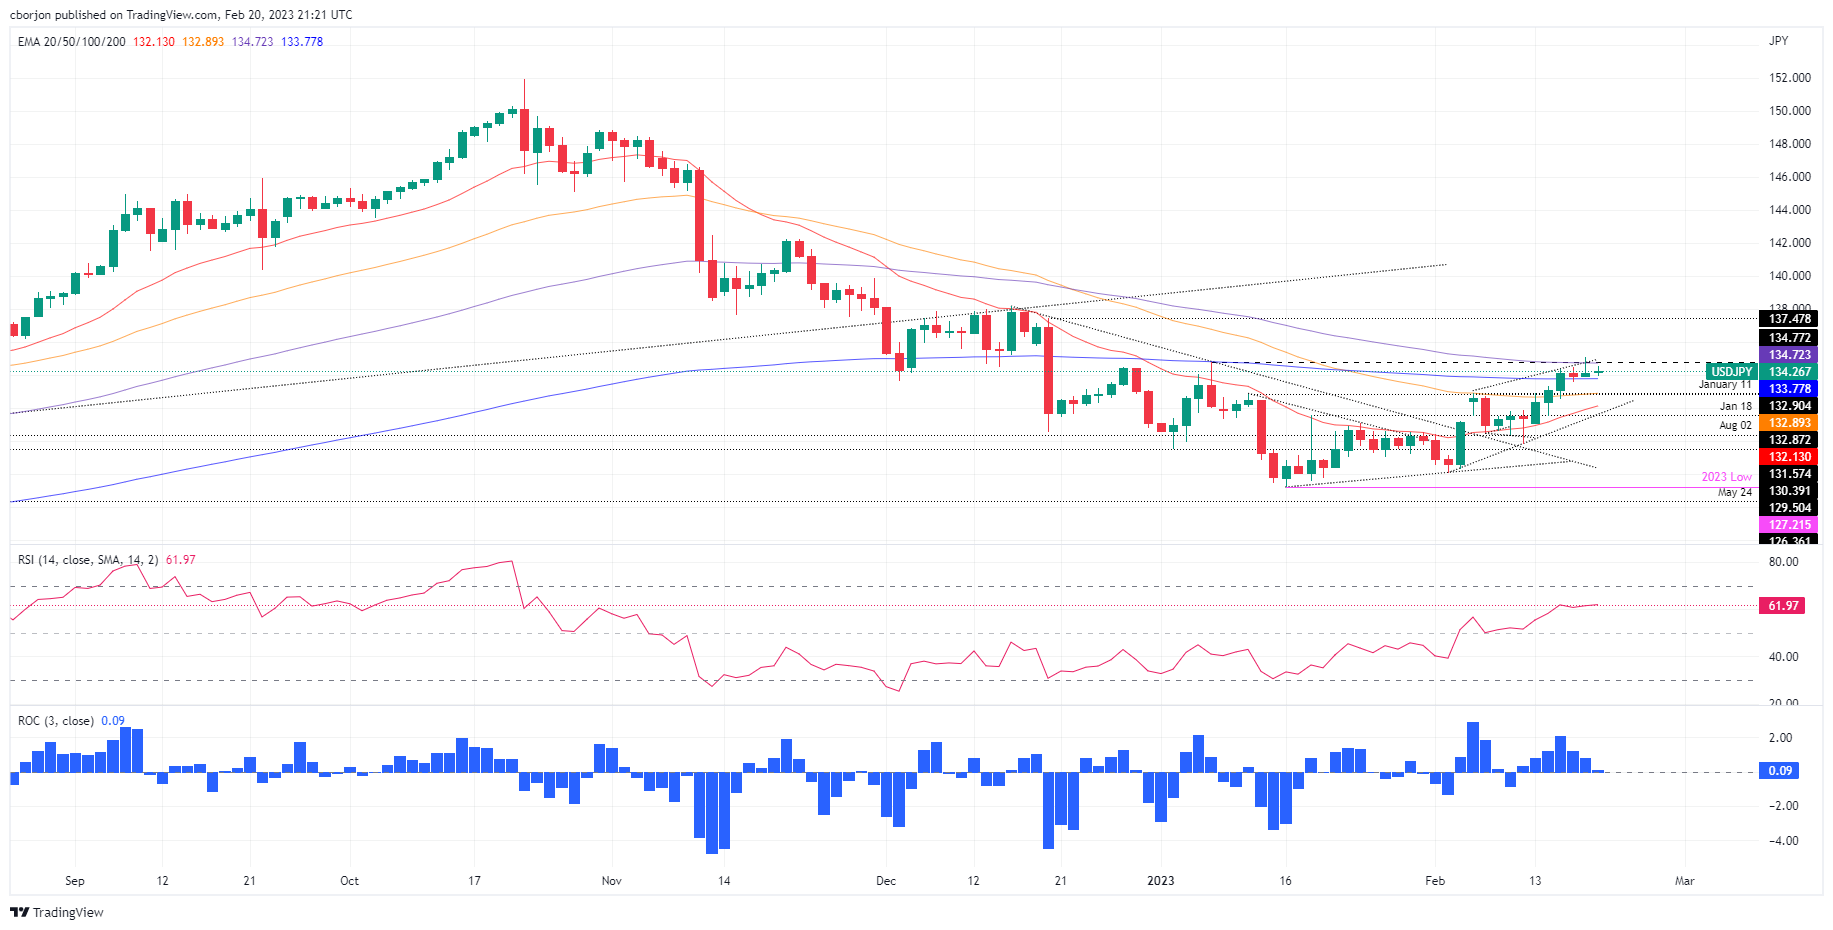
- USD/JPY Technical Analysis: Remain consolidated, slightly upside.
USD/JPY rallied in the Monday session as US financial markets were closed for President’s Day. US stock futures are negative, except for the Dow Jones Industrial Average. The dollar continued its bearish trend, while Treasury yields capped the USD/JPY’s decline. USD/JPY is trading at 134.23, up 0.07% from its opening price.
After recovering from the 50-day EMA at 132.73, USD/JPY enjoyed a rally topping out at around 135.11. Bullish inability to hold gains above the latter exacerbated a slide to the 134.20 zone, driven mainly by falling US 10-year yields, which ended last Friday’s session lower.
Last week’s data on US inflation in the consumer segment showed some slowdown. Prices paid by producers, also known as PPI, rose above estimates and the previous month’s reading on a monthly basis. Therefore, traders shifted from a risk appetite environment to a risk aversion one, as they expect a tougher than estimated US Federal Reserve (Fed).
Meanwhile, changes in the Bank of Japan (BoJ) are increasing the volatility of the pair. With Kazuo Ueda still leading the charge to become the new BOJ Governor, investors are positioning themselves towards a more hawkish stance from the BoJ. Earlier on Monday, in the Asian session, the current BOJ Deputy Governor, Amamiya, stated that the BOJ has the necessary tools to exit the ultra-easy monetary conditions.
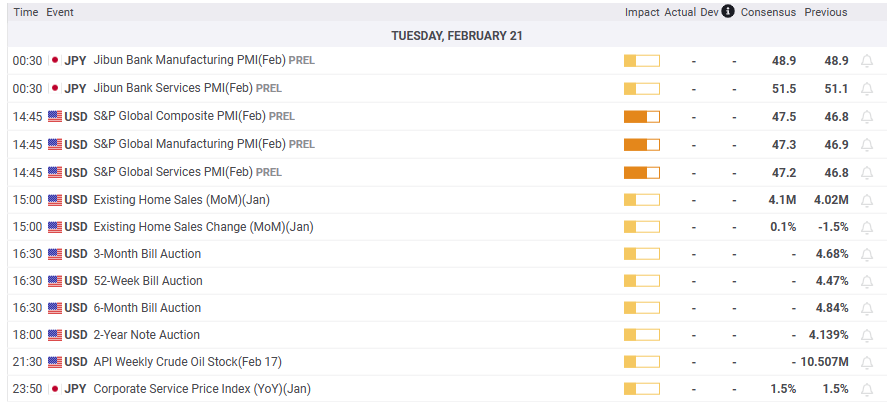
What is there to watch out for?
USD/JPY Technical Analysis
The USD/JPY uptrend lost steam as an inverted hammer formed near the top around 135.00. The failure of buyers to hold compounded a pullback below the 100 day EMA at 134.72, opening the door for consolidation within the important 200 day EMA at 133.77 and 134.70, a 100 point range. The Relative Strength Index (RSI) moved lower but in bullish territory, a sign that buyers are taking a breather, while the Rate of Change (RoC) remains almost unchanged. Break above the 100 day EMA, and USD/JPY could retest 135.00. To the downside, a break below 134.00 would challenge the 200 day EMA.
Source: Fx Street
I am Joshua Winder, a senior-level journalist and editor at World Stock Market. I specialize in covering news related to the stock market and economic trends. With more than 8 years of experience in this field, I have become an expert in financial reporting.


