
- The US economy added 263,000 jobs to the economy, while the unemployment rate fell.
- USD/JPY fell towards 144.66 after the US NFP release and recovered some ground.
- The US 10-year Treasury bond yield is approaching 3.90%, which is often a tailwind for USD/JPY traders who remain cautious following the BoJ intervention in September .
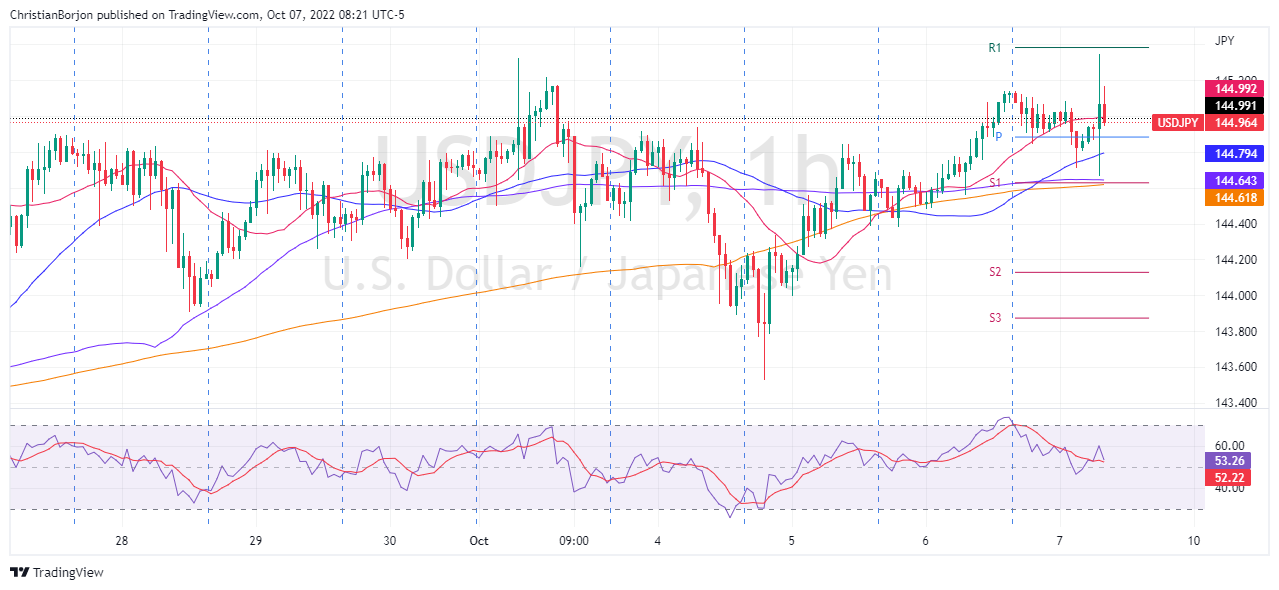
The USD/JPY remains weak after US jobs data surprised market participants as the US economy added more jobs than economists estimated. At the time of writing, USD/JPY is trading around 144.90, below its opening price.
Data released by the US Department of Labor reported that non-farm payrolls increased by 263,000, above estimates of 250,000, while the unemployment rate headed south from 3.7% to 3.5%. , which put additional pressure on the Federal Reserve. Given the expressions of Fed officials over the last week, talking about the tightness of the labor market, the September employment report would probably justify another rate hike of three quarters of a point (0.75%).
Before the US jobs data hit traders’ screens, the chances of the Fed raising rates by 75 basis points stood at 85.5%. Following the report, they increased to 92%.
Elsewhere, the Dollar Index, which measures the value of the dollar against a basket of currencies, extended its gains by 0.31% to 112.636. In particular, the dollar turned 180 degrees and is positive for the week at 0.40%.
US Treasury yields rose, with the 10-year US Treasury yield rising six basis points to 3.895%, creating a tailwind for the USD /JPY.
However, USD/JPY’s uptrend was capped by the 145.00 line imposed on September 22 by the Bank of Japan’s intervention in the markets. It is worth noting that the USD/JPY fluctuated in the range of 144.63-145.34 after the publication of the US NFP.
What must be considered
Next week’s US economic docket will reveal September inflation figures, specifically the Consumer Price Index (CPI), along with the University of Michigan’s Consumer Sentiment.
USD/JPY 1 hour chart
Key USD/JPY Technical Levels
Source: Fx Street
With 6 years of experience, I bring to the table captivating and informative writing in the world news category. My expertise covers a range of industries, including tourism, technology, forex and stocks. From brief social media posts to in-depth articles, I am dedicated to creating compelling content for various platforms.


