
- USD/JPY is biased to the upside as a US dollar rally is underway.
- 134.50 is a line in the sand and the market is biased higher towards 137.50 as long as it is above.
He USD/JPY It is pushing higher despite technical data that has been skewed to the downside, at least for the meantime, in the long that has been accumulating in the market for the past few days. Instead, the bulls remain in control and have focused on the 135 area as volume returns to the currency space.
At the time of writing, the USD/JPY pair is trading at 134.98 and has so far ranged from a low of 134.14 to a high of 135.22. The US dollar has been offering a nice back and forth trade on volatile day trading. However, the dominant theme remains inflation and that is fueling mid-term US bids on the back of even more positive US economic data.
US Treasury yields hit new highs on Tuesday as US data confirmed that both the service and manufacturing sectors have been strong in February, with the S&P Global PMIs outperforming both previous data. like estimates. Investors are bracing for tighter-than-expected monetary policy from the Federal Reserve following a string of strong economic data. “In our opinion, this process still has some way to go,” explained analysts at Brown Brothers Harriman.
Analysts noted that the WIRP suggests increases of 25 basis points in March, May and June, which would put the Fed funds between 5.25 and 5.50%. “Given the strength of recent data, we see increasing risks of a fourth 25 basis point hike to between 5.50 and 5.75%, although this is not yet priced in,” the analysts said.
Oddly enough, an easing cycle is still expected to start in the fourth quarter, but with much lower odds. In the end, it should be fully priced in until 2024 in the next phase of the Fed’s pricing review.
The next major catalyst will be the release by the Federal Reserve of the minutes of its last meeting on Wednesday, which will give traders an idea of how far they expect interest rates to rise after the impressive run of recent data from the first few months. of the year, including stronger-than-expected employment and inflation numbers.
USD/JPY and DXY Technical Analysis
With all of the above, it will be interesting to see how far the US dollar, DXY, can go:
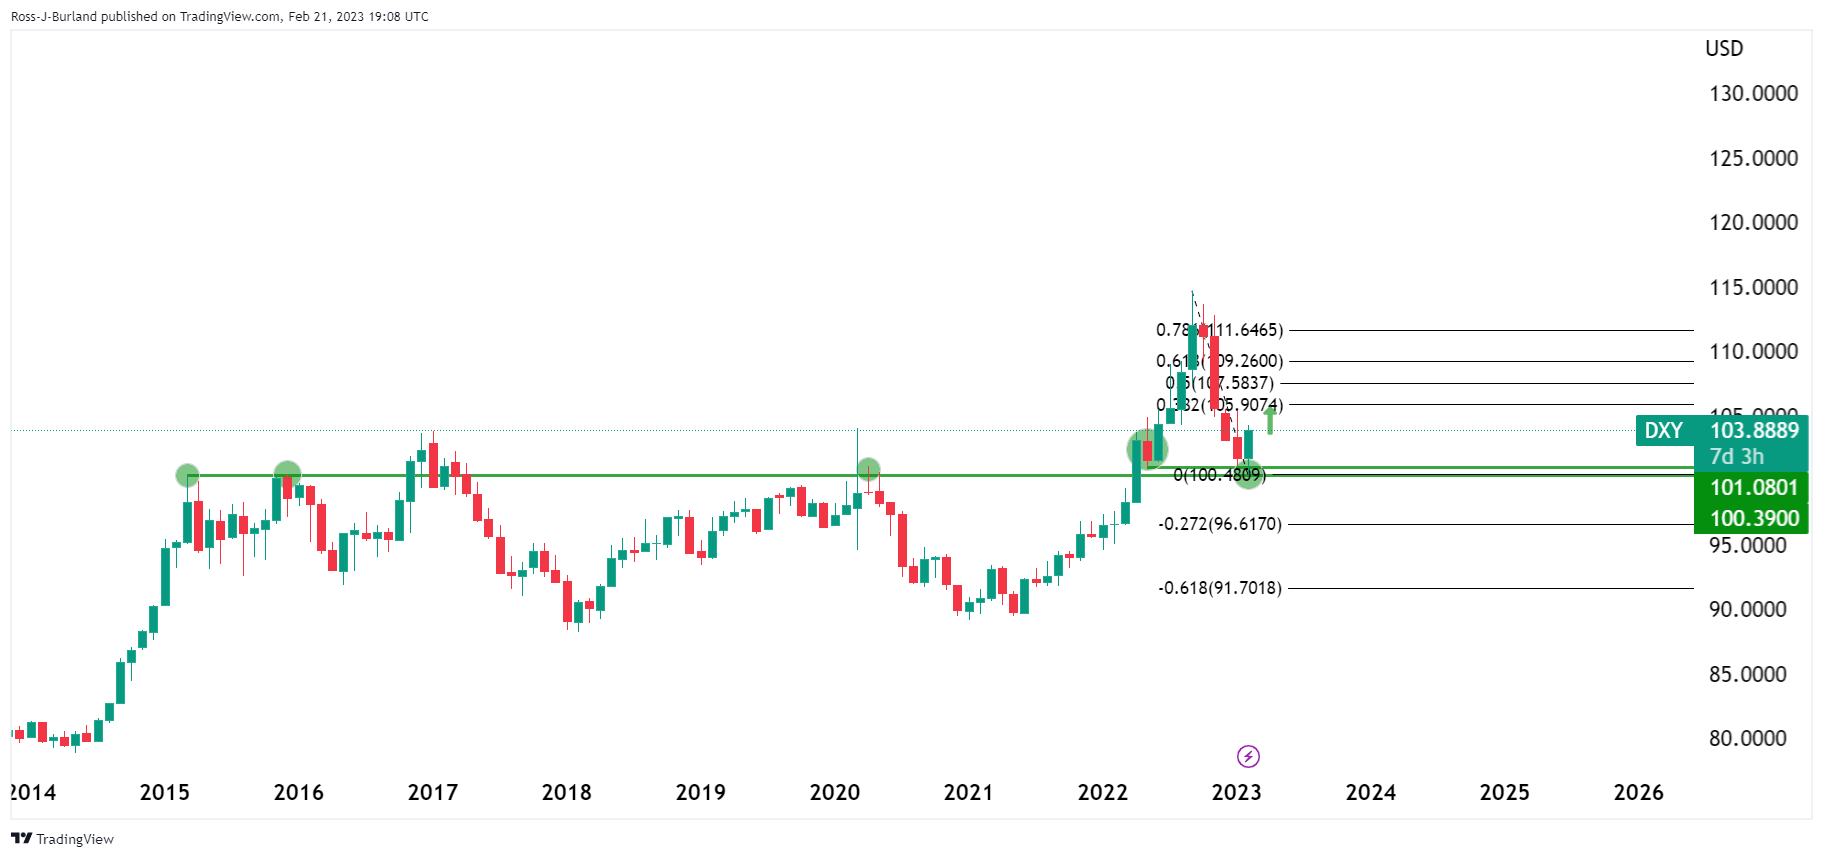
We have seen a number of reactions from recent lows over many months of history in the DXY Index, as the above illustrates, so why would it be any different this time? 101.00 is a strong support level, so the thesis is bullish from here, at least in the meantime.
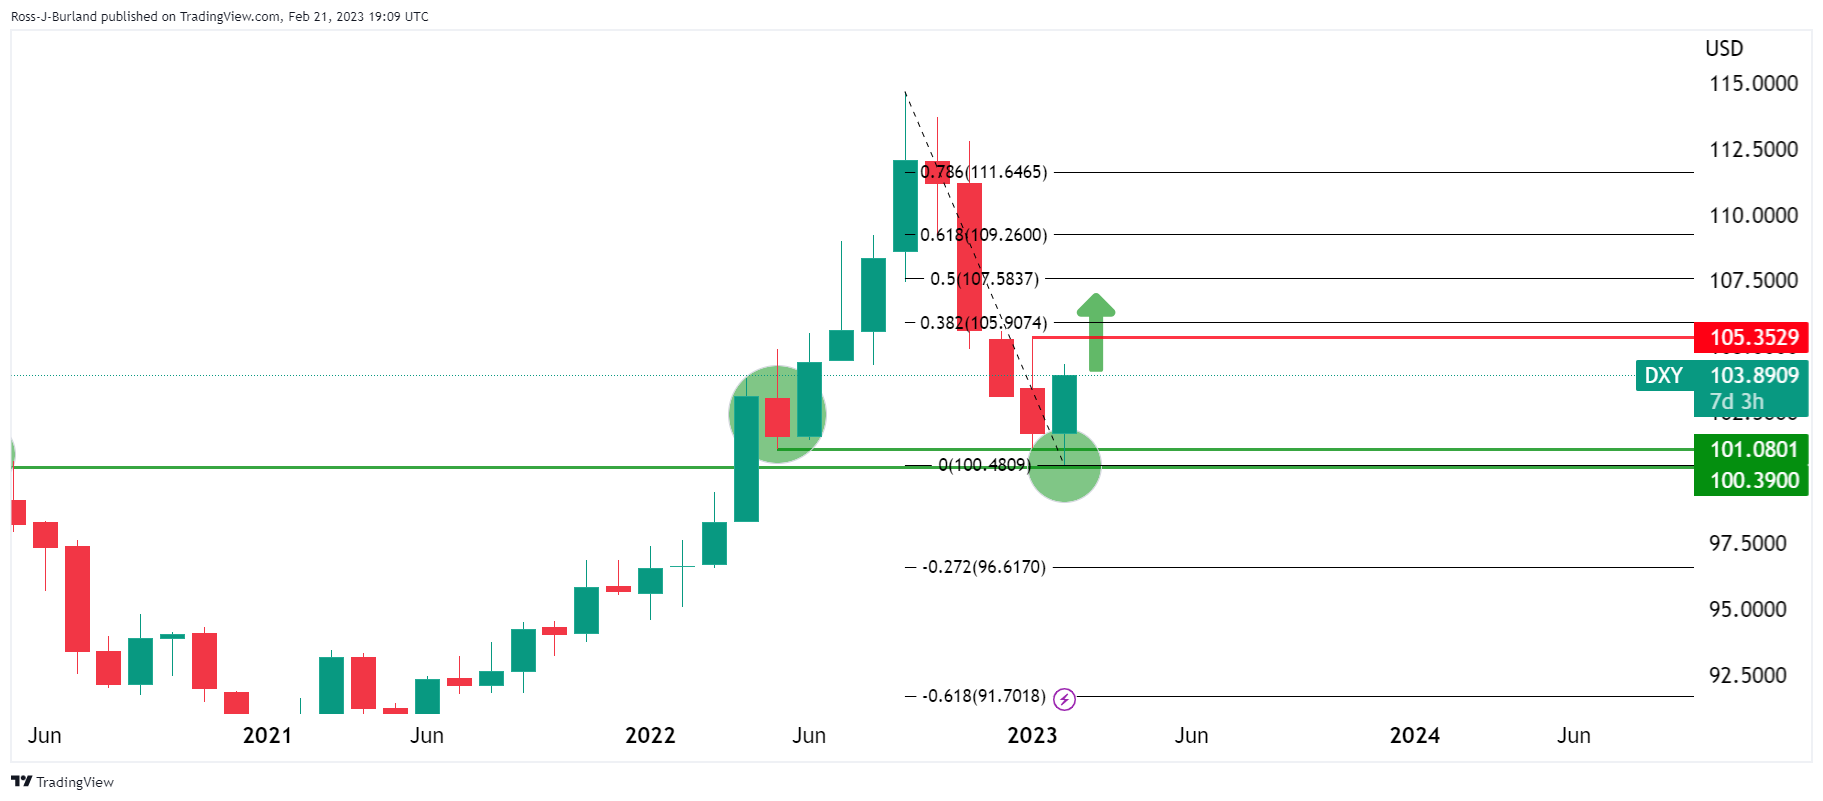
The 38.2% Fibonacci retracement is the first target near 106.00 if prior month highs at 105.35 are broken.
On the weekly chart, 106 is a clear target and resistance zone:
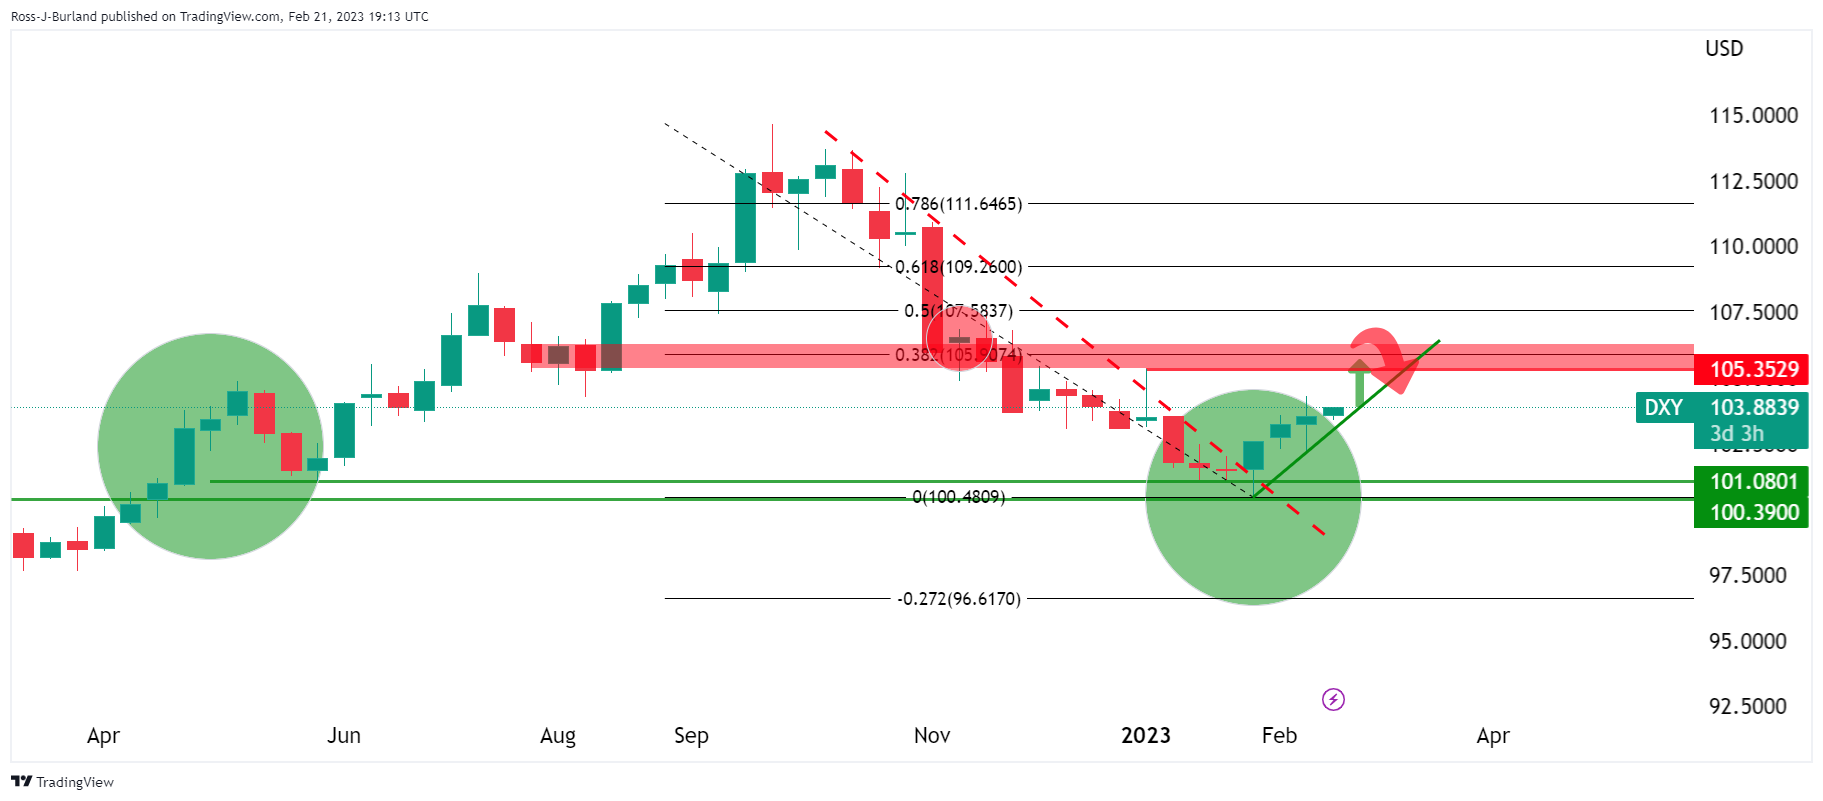
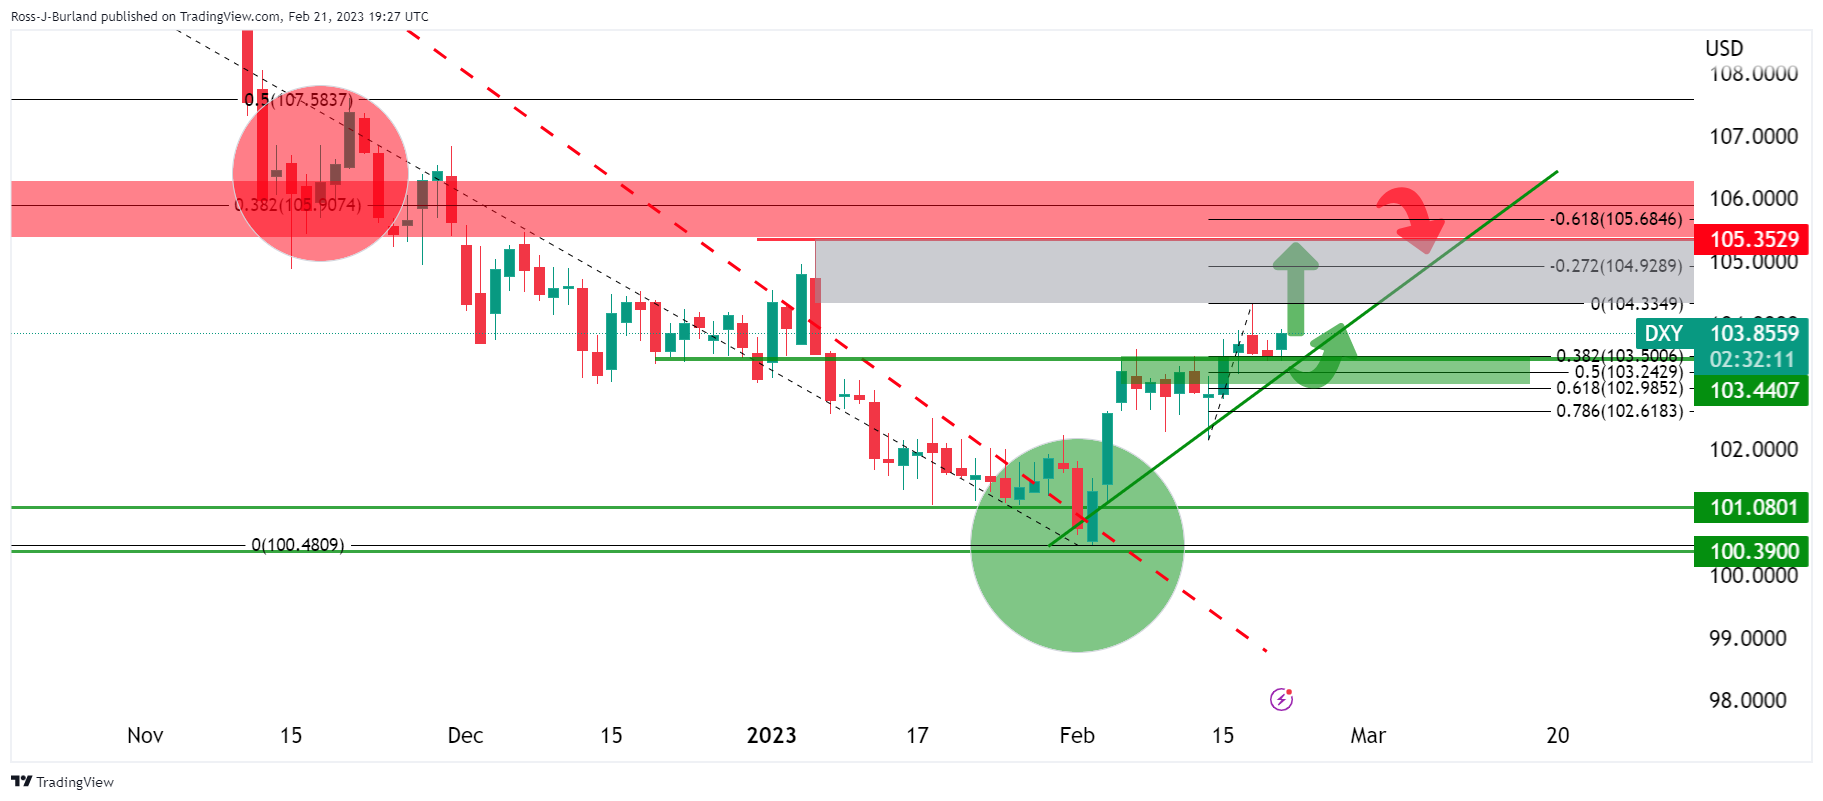
From a daily perspective, 104.30 is immobilized, but there is room to the upside after the correction at the old resistance that now acts as a support structure. Therefore, a continuation can be anticipated to break the gap between today’s highs and all the way to the early year highs near 105.35:
USD/JPY Technical Analysis
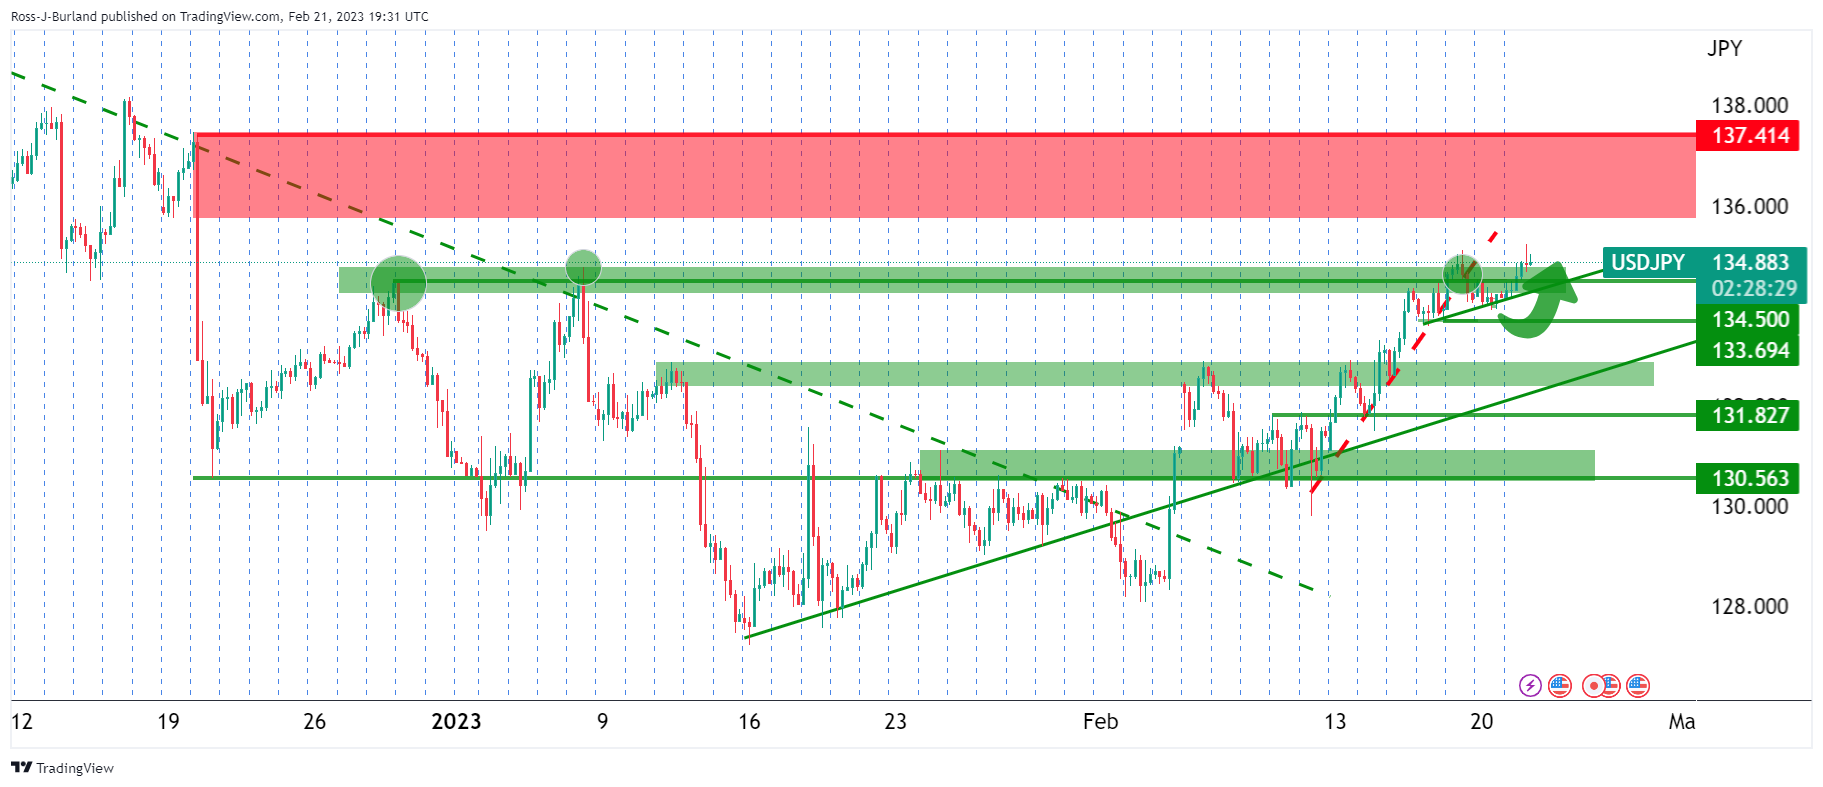
This leaves a bullish bias in the US dollar pairs and the yen is expected to weaken at the USD/JPY four hour resistance in the coming days.
Extension …
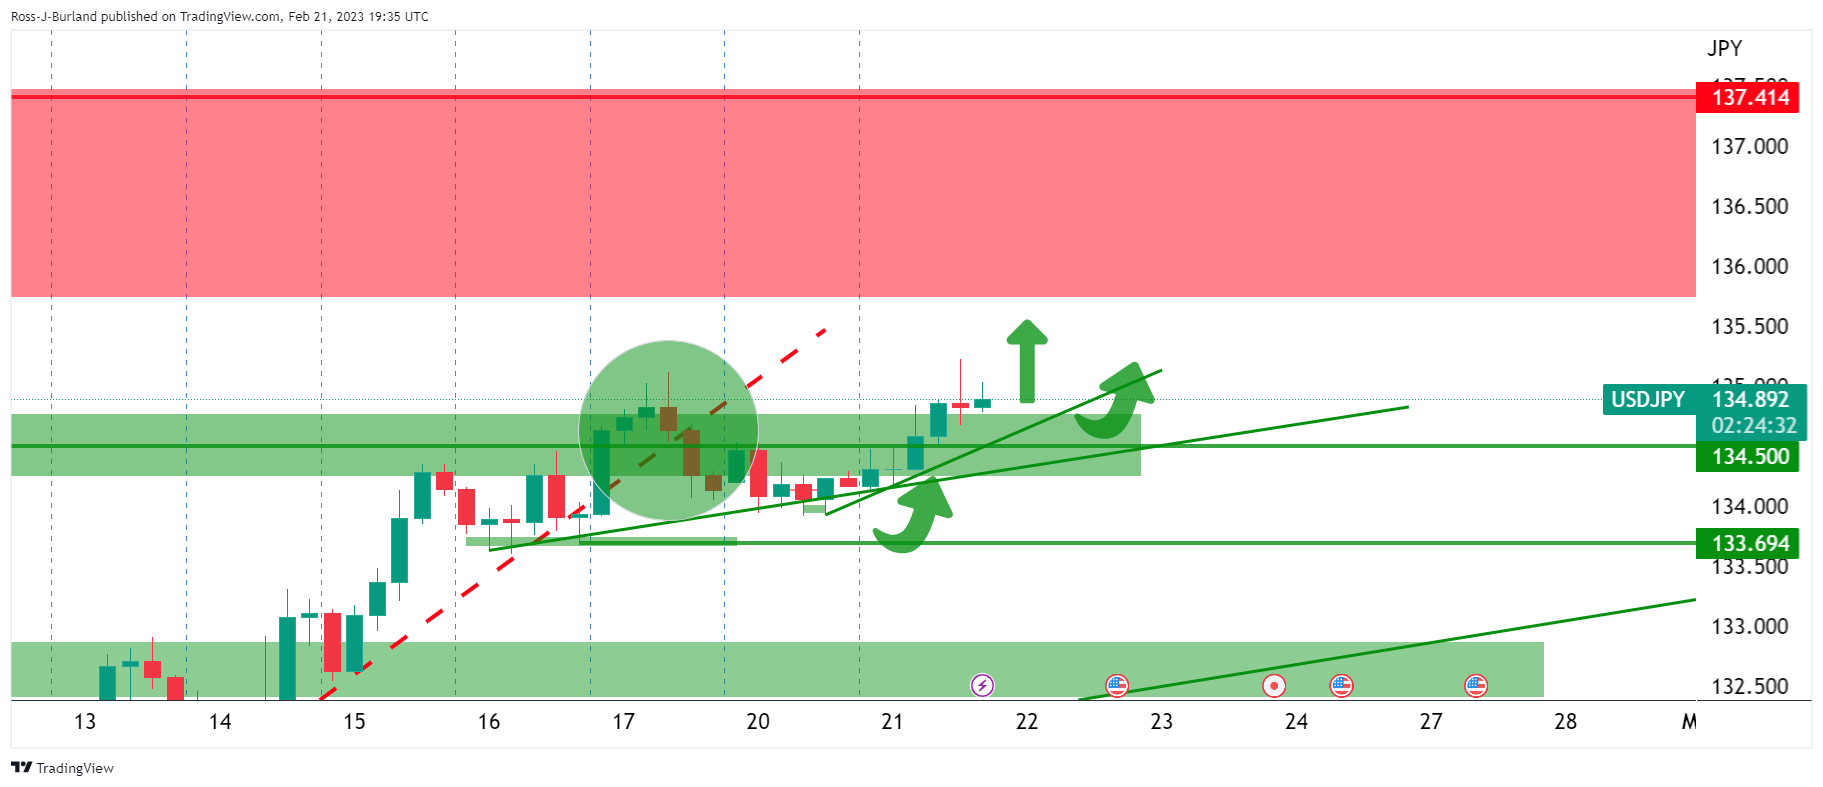
134.50 is a line in the sand and the market is biased higher towards 137.50 as long as it is above.
Source: Fx Street
I am Joshua Winder, a senior-level journalist and editor at World Stock Market. I specialize in covering news related to the stock market and economic trends. With more than 8 years of experience in this field, I have become an expert in financial reporting.


