
- The Indian Rupee appreciates as Indian bonds are scheduled to be included in the JP Morgan Emerging Markets Bond Index on June 28.
- Foreign investors have invested around $10 billion in securities eligible to join the JP Morgan index.
- US annualized GDP (Q1) is expected to show a slight increase of 1.4% from the previous growth of 1.3%.
The Indian Rupee (INR) recovers its recent losses on Thursday as it receives support from expectations of foreign capital inflows. Indian bonds are set to enter the JP Morgan Emerging Markets (EM) Bond Index on June 28. Foreign investors have already invested approximately $10 billion in securities eligible to join JPMorgan’s index, according to Business Standard. Meanwhile, Goldman Sachs anticipates at least $30 billion more in capital inflows in the coming months as India’s weight in the index gradually increases to 10%.
The US Dollar (USD) depreciates possibly due to traders’ anticipation of Friday’s underlying Personal Consumption Expenditure (PCE) Price Index, projected to decline year-over-year to 2.6% from 2.8% previously. This data is considered the preferred inflation indicator of the Federal Reserve (Fed). Market participants hope that signs of slowing inflation will encourage the Federal Reserve (Fed) to consider rate cuts sooner rather than later.
Daily Digest Market Movers: Indian Rupee gains ground amid expected foreign capital inflows
- Lower crude oil prices could support the Indian rupee, the currency of the world’s third-largest oil consumer after the United States and China. The price of West Texas Intermediate (WTI) crude oil drops to around $80.30, at the time of writing. Crude oil prices came under pressure after an unexpected rise in US crude stockpiles, raising concerns about weakening demand from the world’s top oil consumers.
- Reuters quoted Fed Governor Michelle Bowman repeating her view on Tuesday that keeping the policy rate stable for some time will likely be enough to control inflation. Meanwhile, Fed Governor Lisa Cook said it would be appropriate to reduce interest rates “at some point,” given significant progress in inflation and a gradual slowdown in the labor market, although she remained vague on the timing of that. flexibility.
- S&P Global ratings maintained its growth forecast for India at 6.8% for fiscal 2025, citing high interest rates and government spending driving demand in non-agricultural sectors.
- On Tuesday, RBI Governor Shaktikanta Das said India is on the verge of a major structural shift in its growth trajectory, moving towards sustained GDP growth of 8%. Das attributes this growth to several key factors, including structural reforms such as the Goods and Services Tax (GST), as reported by The Economic Times.
- India is expected to become a $4 trillion economy by 2025, overtaking Japan early next fiscal year to become the world’s fourth-largest economy, according to Prime Minister’s Economic Advisory Council (EAC) member PM) of India, Sanjeev Sanyal.
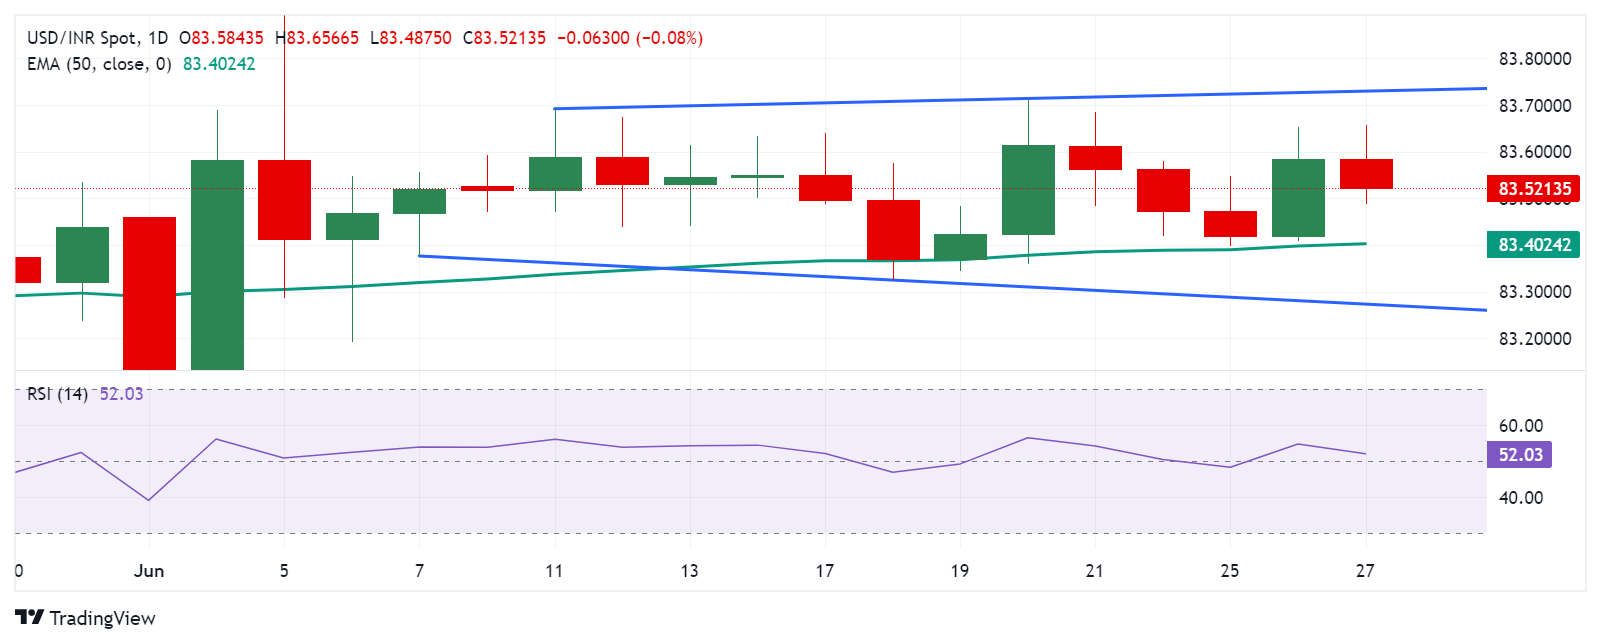
Technical analysis: USD/INR remains around 83.50
The USD/INR is trading around 83.50 on Thursday. The daily chart analysis shows a broadening pattern, which indicates increased volatility. This pattern suggests a possible correction before moving lower. The 14-day Relative Strength Index (RSI) is slightly above the 50 level, and a break below this level could signal a bearish bias.
Immediate support is at the 50-day Exponential Moving Average (EMA) at 83.40. A break below this level could push the USD/INR pair towards the lower boundary of the broadening around 83.30.
To the upside, resistance is expected at the upper boundary of the widening formation around 83.70, followed by the psychological level of 84.00.
USD/INR: Daily Chart
Price of the US Dollar today
The table below shows the percentage change of the US Dollar (USD) against the major currencies listed today. The US Dollar was the weakest against the Australian Dollar.
| USD | EUR | GBP | CAD | AUD | JPY | NZD | CHF | |
| USD | -0.12% | -0.08% | -0.06% | -0.27% | -0.16% | -0.10% | 0.00% | |
| EUR | 0.12% | 0.03% | 0.06% | -0.14% | -0.04% | 0.02% | 0.10% | |
| GBP | 0.08% | -0.04% | 0.02% | -0.17% | -0.07% | -0.01% | 0.06% | |
| CAD | 0.06% | -0.06% | -0.02% | -0.19% | -0.10% | -0.04% | 0.05% | |
| AUD | 0.24% | 0.14% | 0.16% | 0.20% | 0.11% | 0.15% | 0.26% | |
| JPY | 0.15% | 0.04% | 0.06% | 0.09% | -0.09% | 0.05% | 0.13% | |
| NZD | 0.10% | -0.02% | 0.02% | 0.04% | -0.16% | -0.03% | 0.15% | |
| CHF | 0.02% | -0.10% | -0.06% | -0.04% | -0.22% | -0.14% | -0.07% |
The heat map shows the percentage changes of the major currencies against each other. The base currency is chosen from the left column, while the quote currency is chosen from the top row. For example, if you choose the Euro from the left column and move along the horizontal line to the Japanese Yen, the percentage change shown in the box will represent EUR (base)/JPY (quote).
Source: Fx Street
I am Joshua Winder, a senior-level journalist and editor at World Stock Market. I specialize in covering news related to the stock market and economic trends. With more than 8 years of experience in this field, I have become an expert in financial reporting.


