
- USD/CHF will end the week with losses of 2.05%.
- From a daily chart perspective, the major is to the downside as sellers target the 31 Mar low below 0.9200.
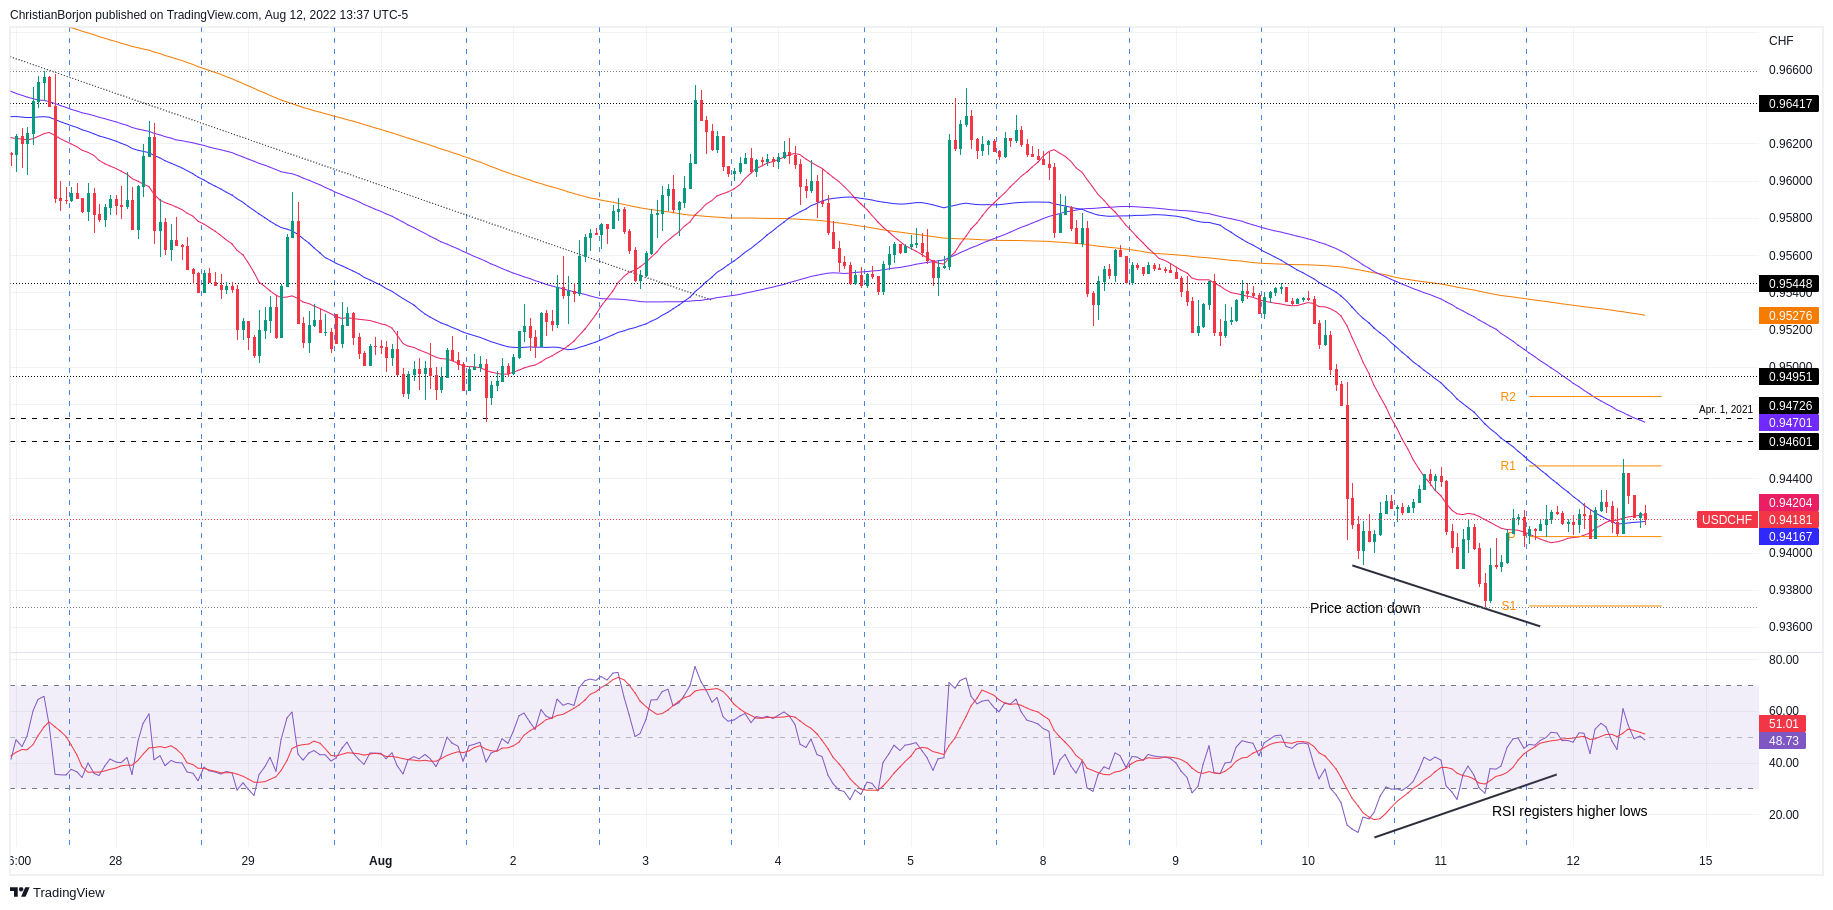
- Despite a positive divergence on the hourly chart, USD/CHF broke through the 200 DMA, but sellers piling on the 200 DMA dragged the pair lower.
The USD/CHF trimmed losses from Thursday but still below the 200 day EMA after making a daily high at 0.9450 but pulled back towards the current price level but still above the opening price. At the time of writing, USD/CHF is trading at 0.9418, up 0.13%.
Trader sentiment is upbeat as US equities are rising strongly. The greenback recovers some ground, as the US Dollar Index shows, rising 0.54% to 105.662, after an improvement in US consumer sentiment eased pressure from the Federal Reserve.
USDCHF Price Analysis: Technical Outlook
From a daily chart point of view, the USD/CHF pair is skewed to the downside, with the sellers remaining in control, despite the fact that the buyers lifted the pair towards its daily high. However, the Relative Strength Index (RSI) stands at 35.91, well below the mid-line of 50, thus a fall towards the March 31 low at 0.9194 is expected.
On the one hour timeframe, USD/CHF is showing a positive divergence with price action heading lower, while the RSI posts a successive series of higher lows. However, as the RSI has already crossed its 50 mid-line, higher and lately lower, the uptrend is in question, but unless the sellers break below the 11 Aug low of 0.9370, the largest could remain in a range.
The first resistance for USD/CHF will be the R1 daily pivot at 0.9447. If it breaks above, it could open the way towards 0.9500. On the other hand, if the pair breaks below 0.9400, it could drop towards 0.9370.
USD/CHF hourly chart
Technical levels
Source: Fx Street
With 6 years of experience, I bring to the table captivating and informative writing in the world news category. My expertise covers a range of industries, including tourism, technology, forex and stocks. From brief social media posts to in-depth articles, I am dedicated to creating compelling content for various platforms.


 estimated 0.6% in the first quarter of 2025, below the planned 0.7% planned")


