
- The dollar remains weaker, despite the fact that the US Nonfarm Payrolls report is upbeat.
- USD/CHF hit a daily high following the US NFP data, but tumbled afterwards.
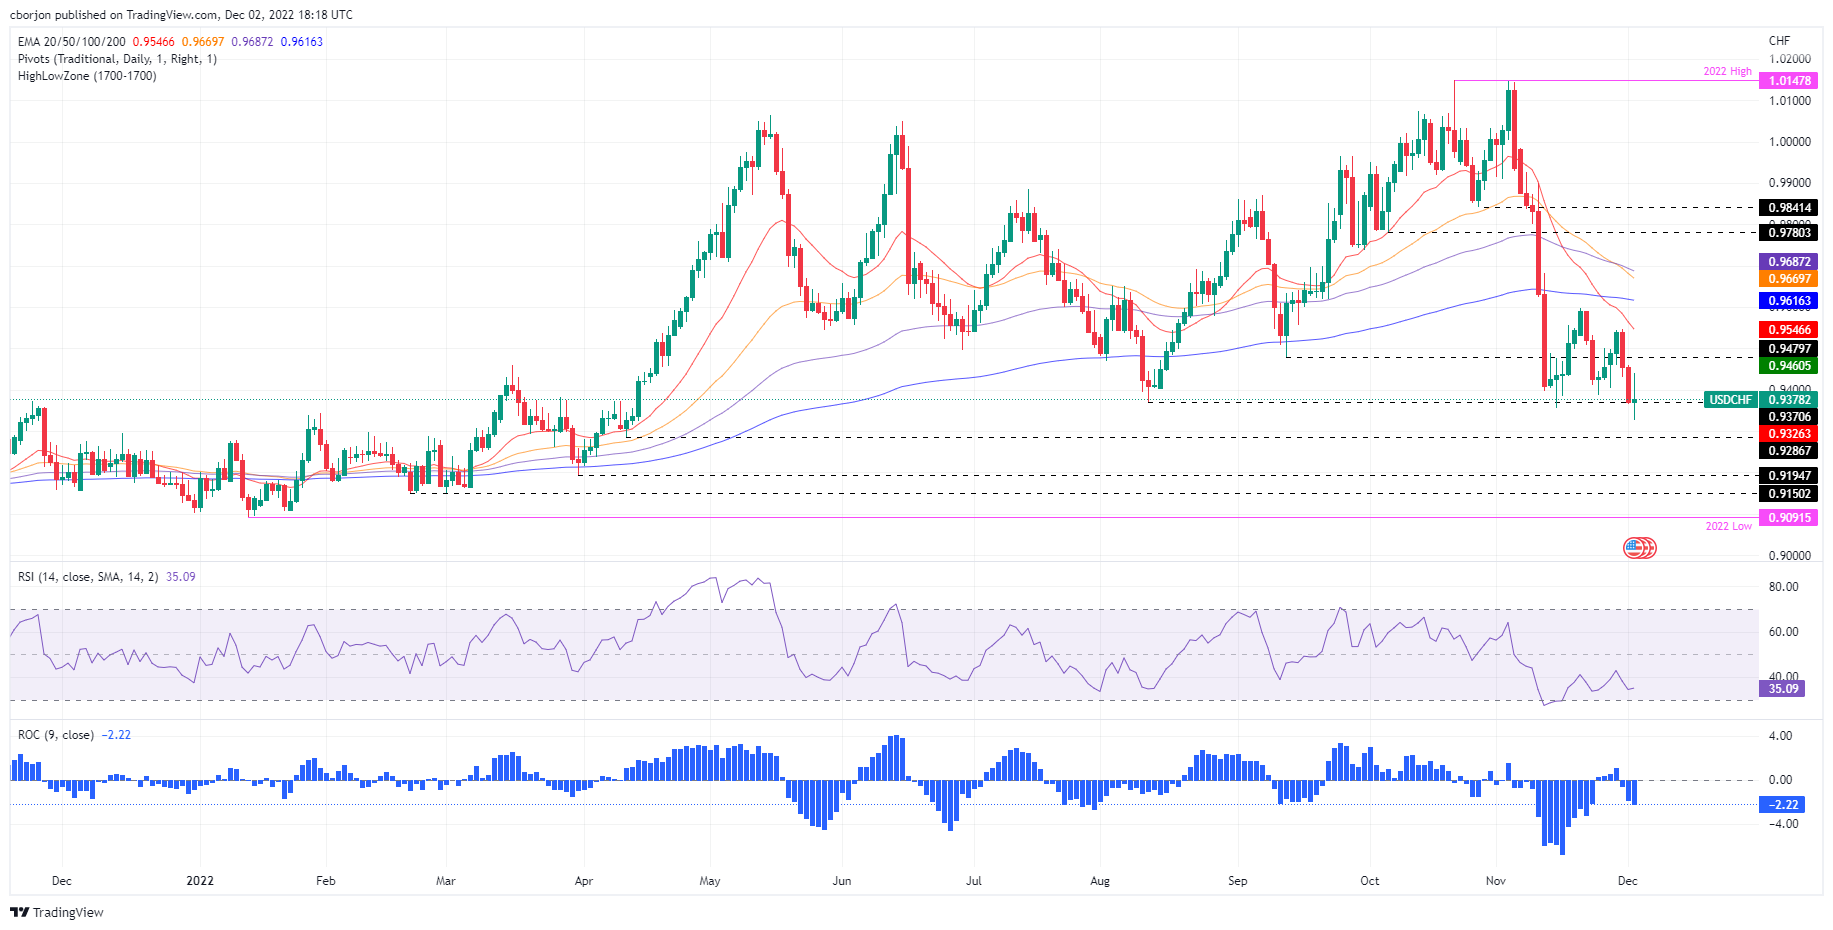
- USD/CHF: Break below 0.9370 to pave the way towards 0.9300.
The USD/CHF pared some of its earlier gains/losses in a volatile trading session, spurred by a US Nonfarm Payrolls report for November, which raised the likelihood that the US Federal Reserve (Fed) will continue to hike the costs of the loans. However, the slowdown in manufacturing activity revived fears of recession in the US economy. Therefore, USD/CHF is fluctuating around 0.9370 at the time of writing.
USD/CHF Price Analysis: Technical Perspective
In Friday’s session, USD/CHF rallied to its daily high of 0.9439 after the NFP figures were released. However, buyers of the Swiss Franc (CHF) used it to open new short positions in USD/CHF, as evidenced by the fact that the main erased its previous gains, returning below the psychological 0.9400.
Oscillators like the Relative Strength Index (RSI) in bearish territory are almost flat, suggesting consolidation ahead, while the 9-Day Rate of Change (RoC) portrays sellers in command.
Therefore, the path of least resistance is biased to the downside. As of this writing, USD/CHF tests the August 11 daily low at 0.9370, which, once broken, could pave the way to test the fresh 7-month low of 0.9326, followed by 0.9300.
Key USD/CHF Technical Levels
Source: Fx Street
I am Joshua Winder, a senior-level journalist and editor at World Stock Market. I specialize in covering news related to the stock market and economic trends. With more than 8 years of experience in this field, I have become an expert in financial reporting.


