
- USD/CHF maintains a strong uptrend on the daily chart, aiming to reach the key resistance of 0.9000.
- A break above 0.9000 could lead to testing the 200-day moving average at 0.9041, followed by the May 31 high at 0.9147.
- Sellers need to push the pair below this week’s low at 0.8893 to regain control and change the momentum.
The Dollar (USD) extended its gains against the Swiss franc (CHF) on Thursday, while the US dollar (USD) at six-month highs, as inflation data from recent days shows inflation remains high. However, money market futures do not forecast a rate hike in September, but November is still open. Therefore, USD/CHF is trading at 0.8964 after hitting a daily low of 0.8914.
USD/CHF Price Analysis: Technical Outlook
The daily chart shows the pair in a steady uptrend, with USD/CHF buyers targeting 0.9000. Breaking this last level would expose the 200-day moving average (DMA) at 0.9041 before the pair reaches the May 31 daily high at 0.9147. On the other hand, sellers must drag prices below the current week’s low at 0.8893 if they want to regain control.
USD/CHF is set to test the 0.9000 level in the near term, but buyers must first recapture the R1 daily pivot at 0.8960. If that level is broken, the pair will aim towards the R2 pivot point at 0.8985 before reclaiming 0.9000. On the contrary, the pair would move lower if it falls below today’s daily low at 0.8914.
USD/CHF Price Action – Daily Chart
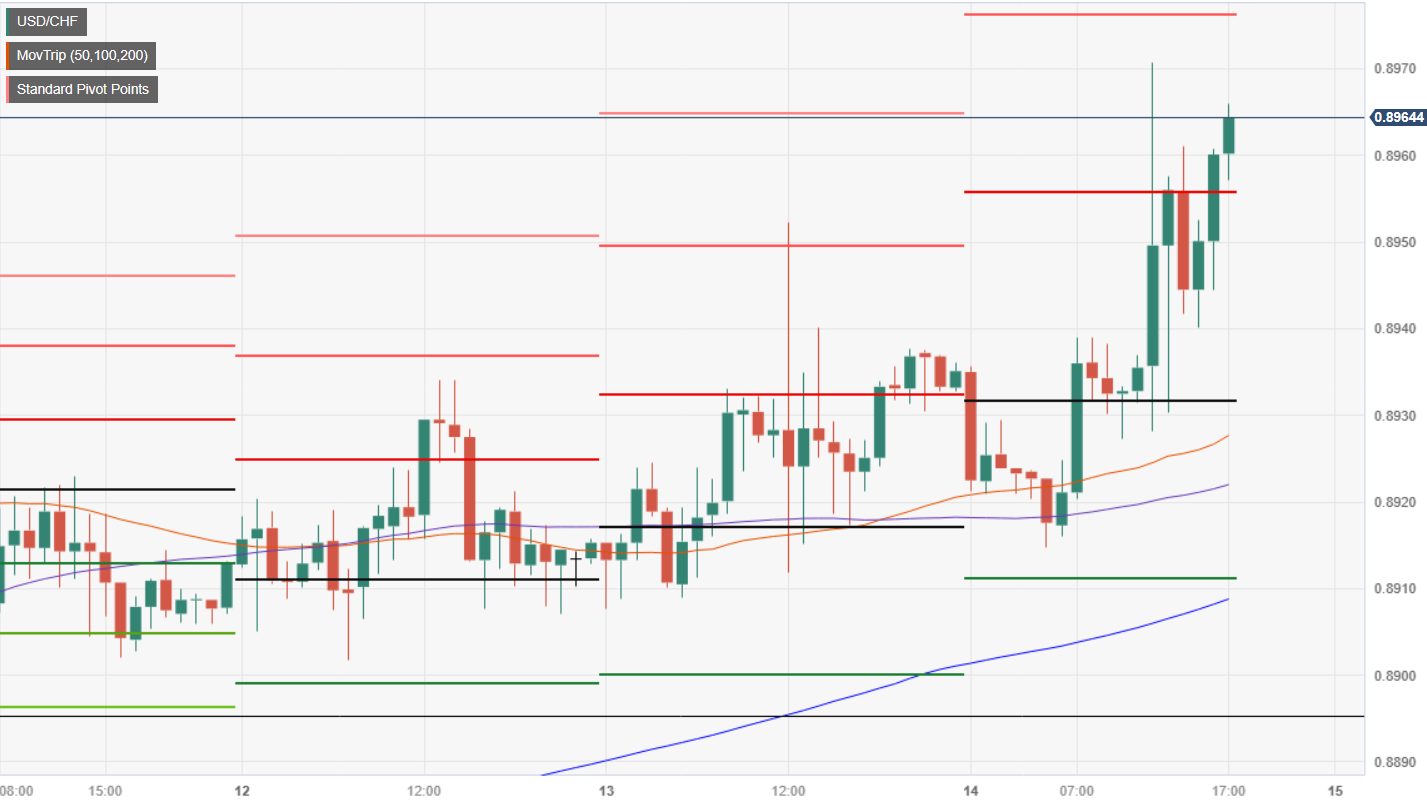
Source: Fx Street
I am Joshua Winder, a senior-level journalist and editor at World Stock Market. I specialize in covering news related to the stock market and economic trends. With more than 8 years of experience in this field, I have become an expert in financial reporting.


