
- USD/CHF flirts with monthly lows below 0.9700 as USD sinks.
- Risk flows dominate markets amid optimism from China and Europe.
- The pair heads lower as the daily RSI enters the negative zone.
USD/CHF moves lower again this Monday after Friday’s temporary pullback as bears follow the US dollar’s relentless decline across the board.
Optimism that easing of restrictions in China could help global growth and an unexpected improvement in German business morale lifted broad market sentiment and weighed on the safe-haven US dollar.
The dollar is also affected by investors’ repositioning ahead of the FOMC minutes, ignoring the rally in US Treasury yields.
From a short-term technical perspective, USD/CHF has broken the 0.9700 support again, and further losses are likely as the 14-day RSI has crossed the mid-line lower.
A daily close below that level is needed to validate the downside break of the horizontal trend line support that defended the pair in early February.
The upsloping 50-day SMA at 0.9553 will be tested if the bears refuse to relinquish control in the short term.
USD/CHF daily chart
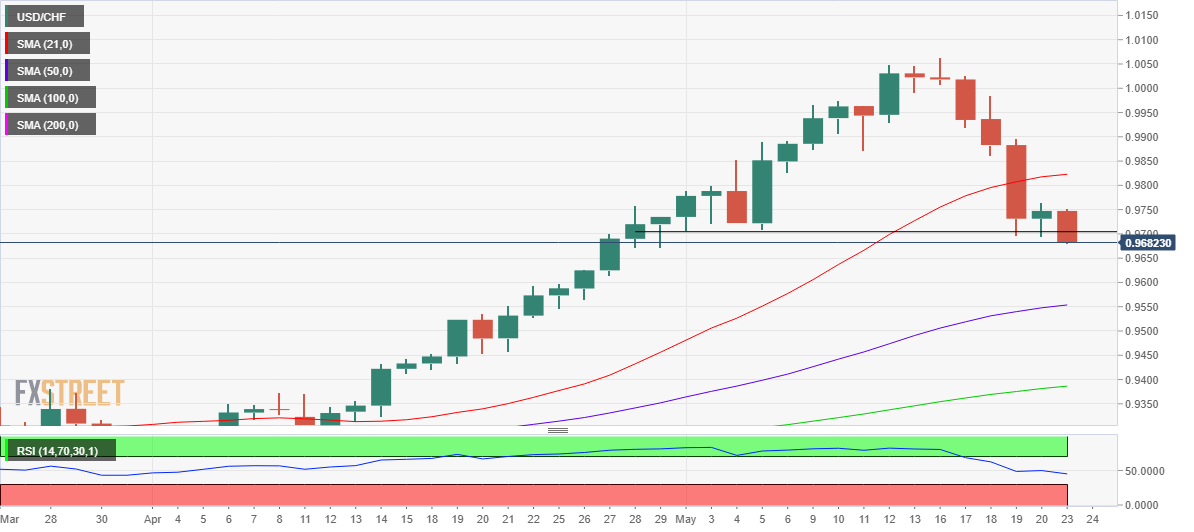
On the other hand, if the bulls regain control, managing to resist above 0.9700, a brief bounce back towards the psychological level of 0.9750 cannot be ruled out.
Further up, USD/CHF buyers could target the upsloping 21 SMA, now at 0.9822.
Note that the previous week’s downward spiral produced a daily close below the 21 SMA for the first time since April 11.
USD/CHF additional levels
Source: Fx Street
With 6 years of experience, I bring to the table captivating and informative writing in the world news category. My expertise covers a range of industries, including tourism, technology, forex and stocks. From brief social media posts to in-depth articles, I am dedicated to creating compelling content for various platforms.

")


