
- USD/CHF consolidates around 0.9935, up 0.47% on the day as traders prepare to attack the parity level.
- High US Treasury yields and a risk-off mood buoy the dollar.
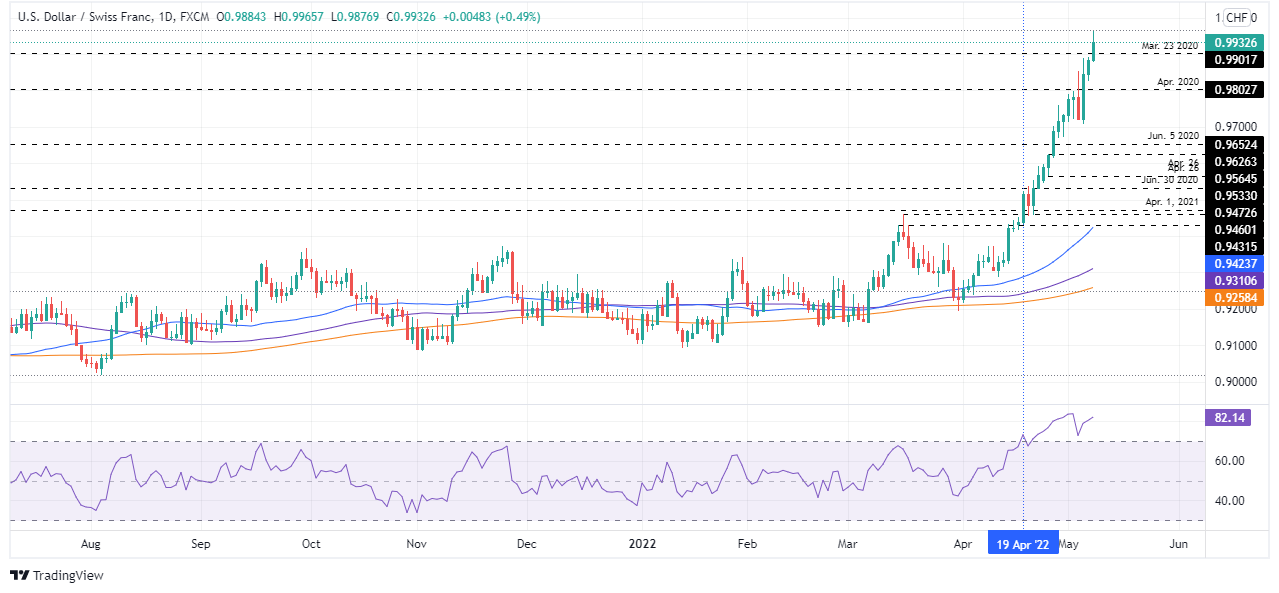
- USD/CHF Price Forecast: Negative divergence between RSI and price action could open the door for a drop towards 0.9700.
The USD/CHF pulled back from yearly highs around 0.9965 as traders prepared to launch an assault towards the parity level, but a negative market mood and USD traders’ booking gains were the main reason USD/CHF held around 0.9900. At the time of writing, the USD/CHF is trading at 0.9932.
Monday’s focus is on high US Treasury yields, as the 10-year yield hit a four-year high in the last week, though at time of writing it sits at 3,075%. In addition, China’s exports slowed to single digits, the weakest in nearly two years, as tighter and broader coronavirus restrictions halted industrial production and reduced domestic demand, adding to broader economic woes. wide.
On Monday, USD/CHF opened in the Asian session below the 0.9900 mark, but market sentiment increased appetite for the dollar, which topped the R2 daily pivot at 0.9930, just shy of the R3 pivot at around 0.9970.
USD/CHF Price Forecast: Technical Outlook
The USD/CHF daily chart keeps the pair skewed to the upside, although profit-taking USD/CHF traders caused a slight drop towards 0.99035. The Relative Strength Index (RSI), around 82.29, is pointing slightly lower, which means a negative divergence between the RSI and price action will occur.
The first support of the USD/CHF would be 0.9900. A break below would expose essential demand levels, such as the April 2020 high around 0.9802, followed by 0.9700. To the upside, the first resistance of the major would be the daily high of May 9 at 0.9965. The breakdown of the latter would expose the parity level.
Technical levels
Source: Fx Street
With 6 years of experience, I bring to the table captivating and informative writing in the world news category. My expertise covers a range of industries, including tourism, technology, forex and stocks. From brief social media posts to in-depth articles, I am dedicated to creating compelling content for various platforms.


