
- The USD/CHF is preparing to end the week with significant losses of 1.01%.
- From a daily chart perspective, USD/CHF has turned into a neutral-bearish bias.
- The USD/CHF hourly chart reinforces the daily bias as sellers target a break below 0.9495 on their way to the 200 DMA.
The USD/CHF falls for the fourth consecutive day out of five this week, approaching the June 29 cycle low at 0.9495, which, if broken decisively, would pave the way for a USD/CHF drop towards the 200-day EMA at 0.9409 . At the time of writing, USD/CHF is trading around 0.9517.
USD/CHF Price Analysis: Technical Outlook
The USD/CHF daily chart shows that the pair has moved into a neutral to bearish bias. Oscillator readings, particularly the Relative Strength Index (RSI), are in bearish territory and nowhere near reaching oversold conditions, opening the door for further USD/CHF bearish action. Therefore, as mentioned above, once the major breaks above 0.9495, that will open the door for further losses.
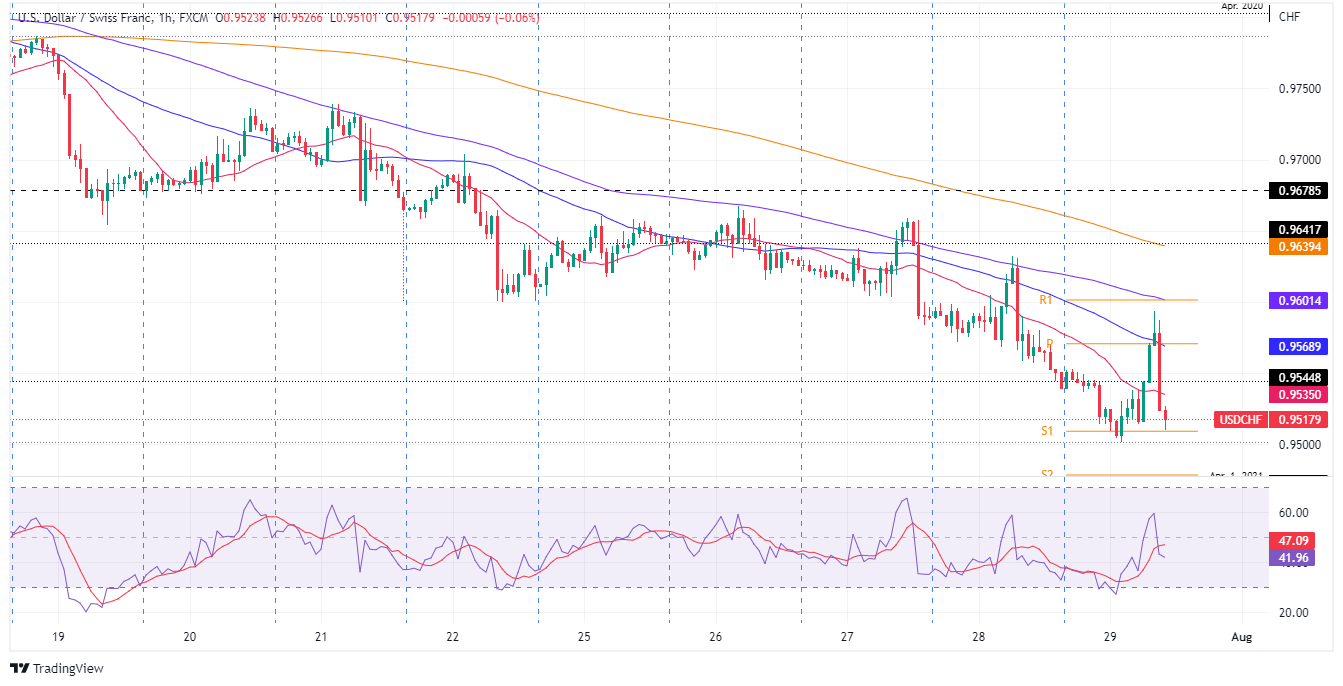
USD/CHF 1 hour chart
In the short term, the USD/CHF 1 hour chart shows that the pair has been trading between the daily high and low at 0.9593 and 0.9501, respectively. However, once the dust has settled, the exchange rate is at current levels, just above the daily S1 pivot. USD/CHF traders should note that in the last few hours, the RSI slipped below its 7-period SMA, which suggests that bearish pressure is on the horizon.
Therefore, the USD/CHF bias is bearish, and its first support would be 0.9495. Once broken, the next support would be the confluence of the April 2020 low and the S2 pivot point around 0.9472-80, followed by the S3 daily pivot point at 0.9417.
Technical levels
Source: Fx Street
With 6 years of experience, I bring to the table captivating and informative writing in the world news category. My expertise covers a range of industries, including tourism, technology, forex and stocks. From brief social media posts to in-depth articles, I am dedicated to creating compelling content for various platforms.


