
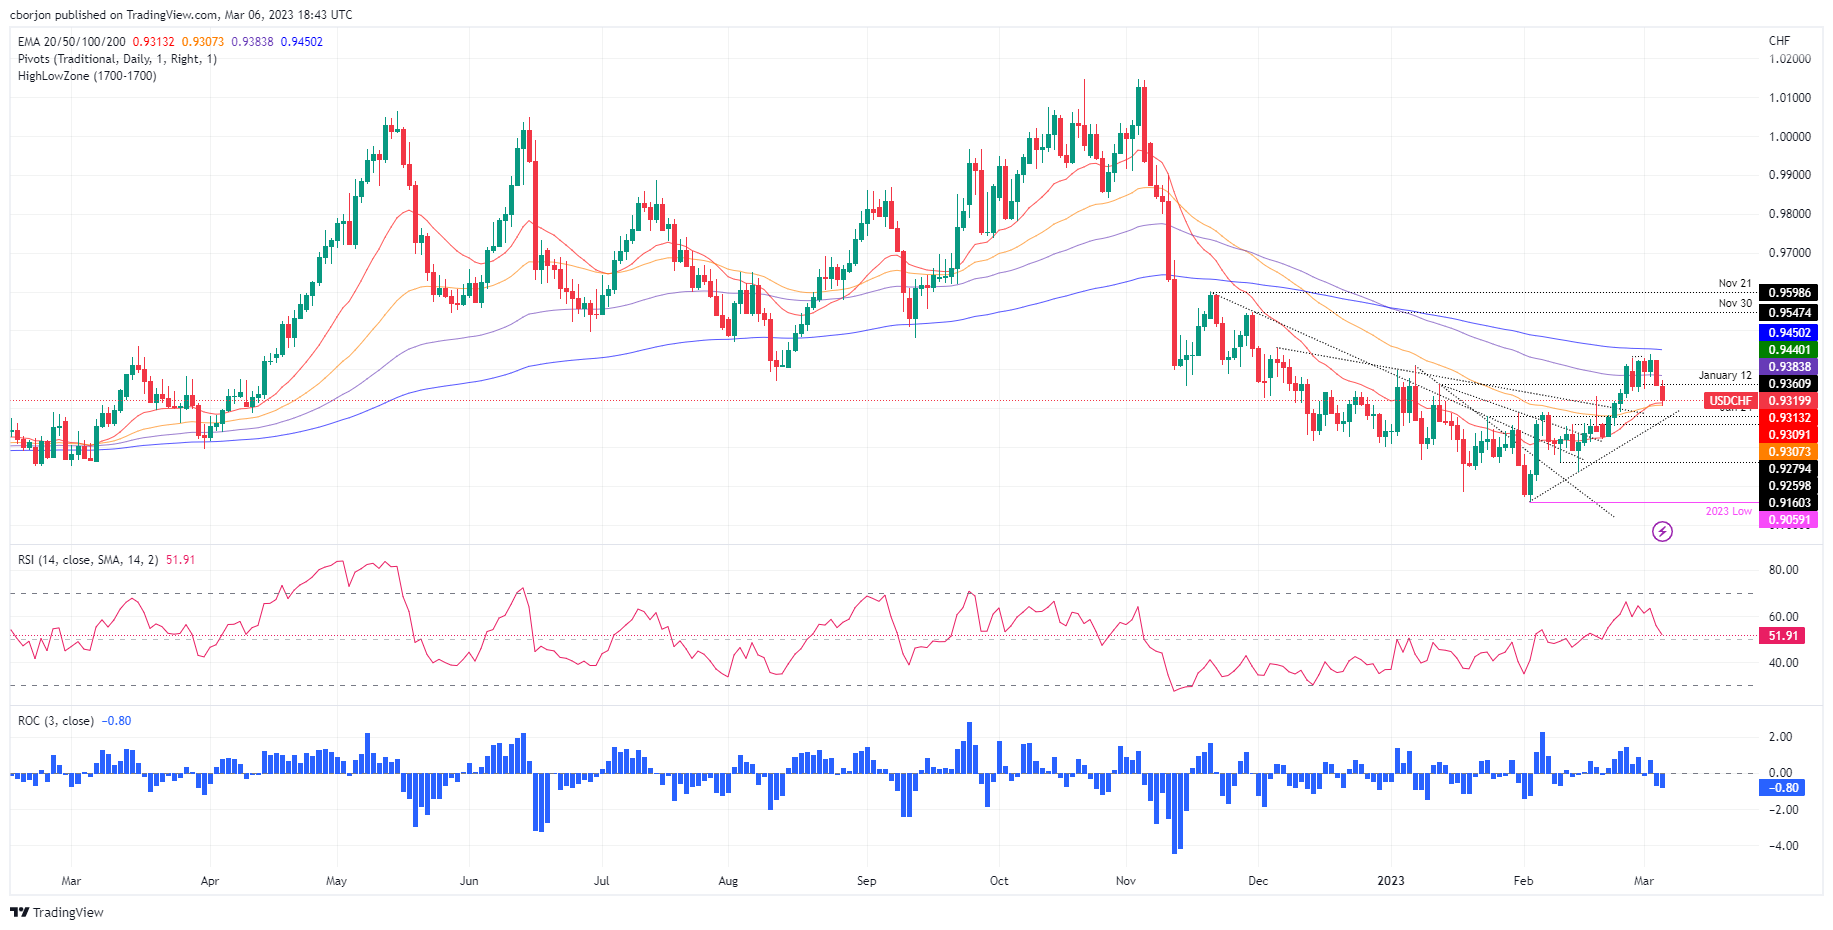
- USD/CHF fell below the 100 day EMA, waiting for a break below the 20/50 day EMAs.
- The Relative Strength Index is trending lower, but about to turn bearish.
- USD/CHF Price Analysis: The failure to break the 200 day EMA opened the door for a further drop.
He USD/CHF It fell after failing to test the 200 day EMA, which extended its losses beyond the 100 day EMA at 0.9383. USD/CHF, Monday’s high, was 0.9373 before pulling back towards the low of 0.9315. At the time of writing, USD/CHF is trading at 0.9317, down 0.44% or 40 points.
USD/CHF Price Action
At the start of the first full week of March, USD/CHF remains bearish in tone but faces solid support at the confluence of moving averages. The 20 and 50 day EMAs rest at 0.9313 and 0.9307, respectively, zones that are the first lines of defense for USD/CHF bulls. A break below would expose the psychological price level of 0.9300, ahead of a month-old uptrend support trend line at 0.9270.
Although the USD/CHF trend is bearish, the Relative Strength Index (RSI) is still bullish but is pointing lower. If the RSI turns bearish, the downtrend would accelerate and the year low at 0.9059 would be in play.
As an alternative scenario, the first resistance for USD/CHF would be the 100-day EMA at 0.9383. Breaking above will expose 0.9400, before the important 200 day EMA at 0.9450, before reaching towards the key psychological level of 0.9500.
USD/CHF Daily Chart
USD/CHF Technical Levels
Source: Fx Street
I am Joshua Winder, a senior-level journalist and editor at World Stock Market. I specialize in covering news related to the stock market and economic trends. With more than 8 years of experience in this field, I have become an expert in financial reporting.


