
- USD/CAD retests weekly lows on Friday and comes under pressure from a combination of factors.
- Fed rate cut bets weigh on USD, while a rebound in oil prices benefits the Loonie.
- The downside remains limited ahead of monthly US and Canadian employment data.
The USD/CAD pair is attracting sellers for the third consecutive day and remains depressed below the psychological level of 1.3500, or the weekly low during the European session on Friday.
The selling bias of the US Dollar (USD) remains unchanged on bets for a larger interest rate cut by the Federal Reserve (Fed) in September. Adding to this, a rebound in crude oil prices is seen underpinning the commodity-linked Loonie and exerting downward pressure on the USD/CAD pair. However, the downside seems limited as traders might choose to wait for the release of crucial monthly employment data from the US and Canada, which will be released later during the North American session.
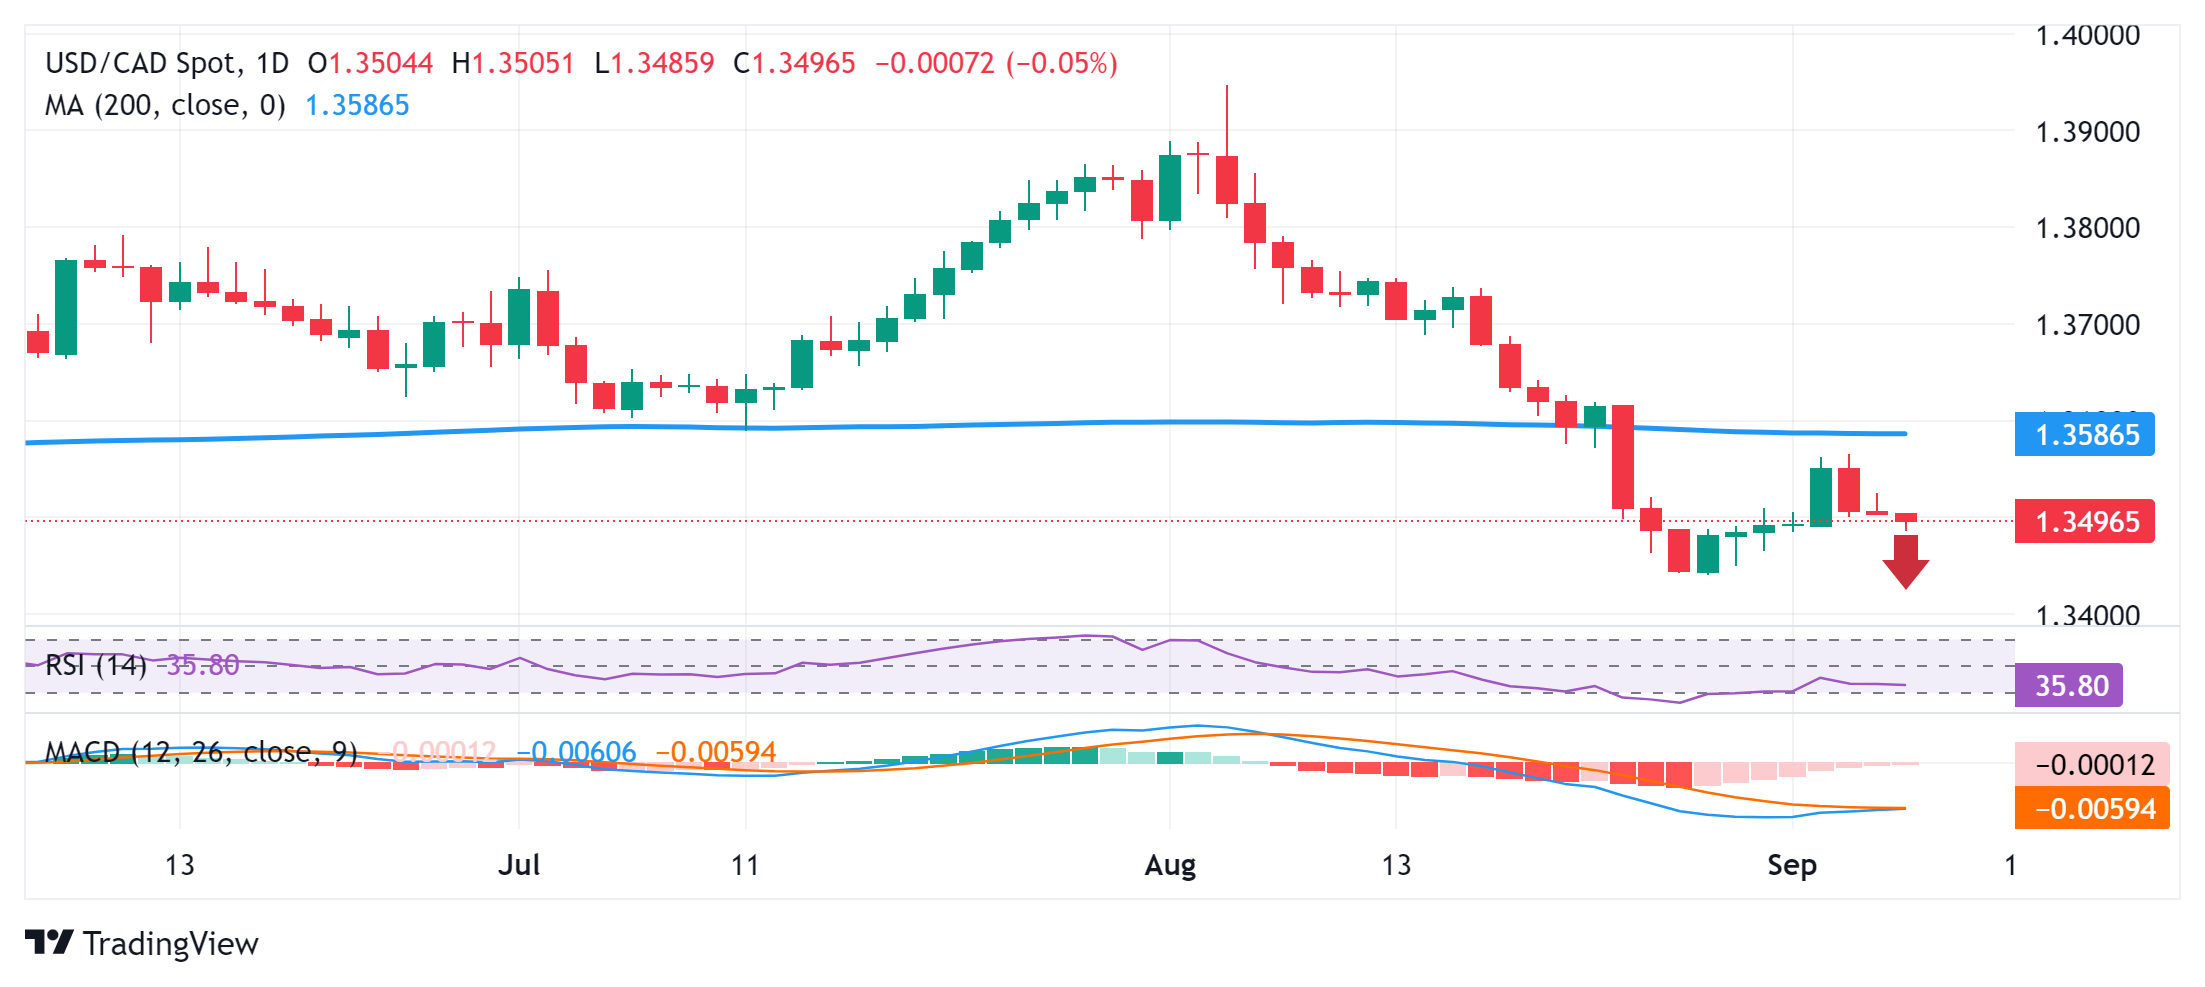
From a technical perspective, the recent break through the very important 200-day Simple Moving Average (SMA) was seen as a fresh trigger for bearish traders. Moreover, oscillators on the daily chart have bounced back from the oversold zone and are still holding deep in negative territory. This suggests that the path of least resistance for the USD/CAD pair is to the downside and supports prospects for an extension of the decline from the 1.3565 zone or a near two-week high touched on Wednesday.
However, traders need to wait for some follow-through selling below the 1.3485 region, or the weekly low, before positioning for further losses. The USD/CAD pair could then accelerate the decline towards the multi-month low, around the 1.3440 zone touched last week before eventually dropping to the March monthly low, around the 1.3420 region. The downward trajectory could extend further towards the 1.3400 level en route towards the next relevant support near the 1.3365-1.3360 zone.
On the other hand, the overnight high, around the 1.3525 region, might cap any recovery attempts ahead of the 1.3565 zone, or the weekly high. The subsequent move higher has the potential to take the USD/CAD pair back towards the breakout point of the 200-day SMA support-turned-resistance, currently located near the 1.3590 zone. Sustained strength beyond the latter could negate the near-term negative bias and trigger a short-covering rally towards the 1.3640-1.3645 resistance.
USD/CAD daily chart
Economic indicator
Unemployment rate
The unemployment rate that is published Statistics Canada is the number of unemployed workers divided by the active population. A fall in this indicator has positive implications for consumer spending, which stimulates economic growth. A rise in the rate would indicate a weakening of economic activity. A result below expectations is bullish for the Canadian dollar, while a result above expectations is bearish.
Next post:
Fri Sep 06, 2024 12:30 PM
Frequency:
Monthly
Dear:
6.5%
Previous:
6.4%
Fountain:
Statistics Canada
Why is it important for operators?
Source: Fx Street
I am Joshua Winder, a senior-level journalist and editor at World Stock Market. I specialize in covering news related to the stock market and economic trends. With more than 8 years of experience in this field, I have become an expert in financial reporting.


