
- USD/CAD continues to fall to 1.3720 as Canadian Dollar remains strong despite weak oil prices.
- This week, the US core PCE price index and first quarter GDP data will guide the US dollar.
- The pair corrects after a strong rally, driven by the breakout of an ascending triangle.
The USD/CAD pair continues its bearish streak for the fourth consecutive session. The Canadian Dollar asset falls to 1.3720, as investors have supported the Canadian Dollar against the US Dollar despite multiple headwinds.
The Canadian Dollar maintains its strength even as the price of oil plummets below $81.00. The attractiveness of the oil price weakens as geopolitical risks diminish following Friday's events in the Middle East, which indicated that Iran was downplaying Israel's limited retaliatory strike. Falling oil prices often dent demand for the Canadian dollar, as Canada is the largest exporter of oil to the United States.
Furthermore, the moderating outlook for Canadian inflation is failing to dampen the outlook for the CAD. The Bank of Canada's (BoC) preferred measure of inflation, which excludes eight volatile items, fell annually to 2% in March, raising expectations of a soon rate cut.
Meanwhile, the US Dollar consolidates above 106.00 as investors focus on preliminary first quarter Gross Domestic Product (GDP) data and March Personal Consumption Price Index (PCE), which They will be published on Thursday and Friday, respectively.
USD/CAD rose strongly after breaking the ascending triangle formed on the daily chart. The near-term outlook remains strong as the 20-day and 50-day EMA, trading around 1.3680 and 1.3600, respectively, move higher.
The 14-period relative strength falls to near 60.00, but still remains within the bullish range of 60.00-80.00.
Since a mild correction is usually followed by a strong rise after a breakout, a mean reversion move near the 20-day EMA around 1.3680 will present a buying opportunity for market participants. Investors would find resistance near the November 22, 2023 high at 1.3766, followed by the round level resistance at 1.3800.
In an alternative scenario, a break below the April 9 low around 1.3547 would expose the asset to psychological support at 1.3500 and the March 21 low around 1.3456.
USD/CAD daily chart
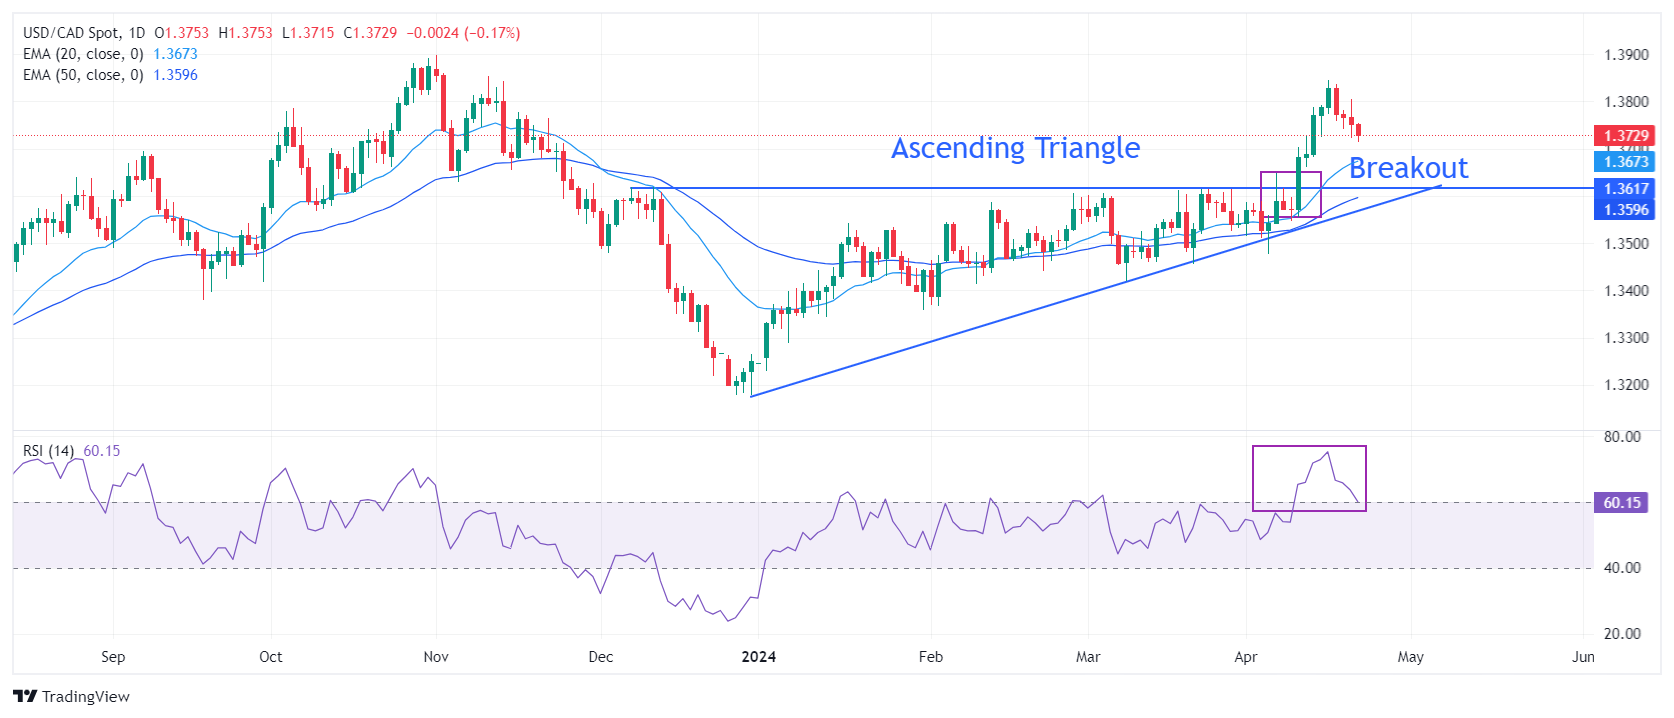
Source: Fx Street
I am Joshua Winder, a senior-level journalist and editor at World Stock Market. I specialize in covering news related to the stock market and economic trends. With more than 8 years of experience in this field, I have become an expert in financial reporting.


