
- Bulls eye the 38.2% ratio as their first stop.
- Beyond daily resistance, bulls target 1.3560.
He USD/CAD has been in the hands of the bulls at the start of the week, as benchmark government bond yields rose and despite the surprise in US economic data. However, the technical outlook remains bullish, as as can be seen from the following analysis:
USD/CAD daily chart
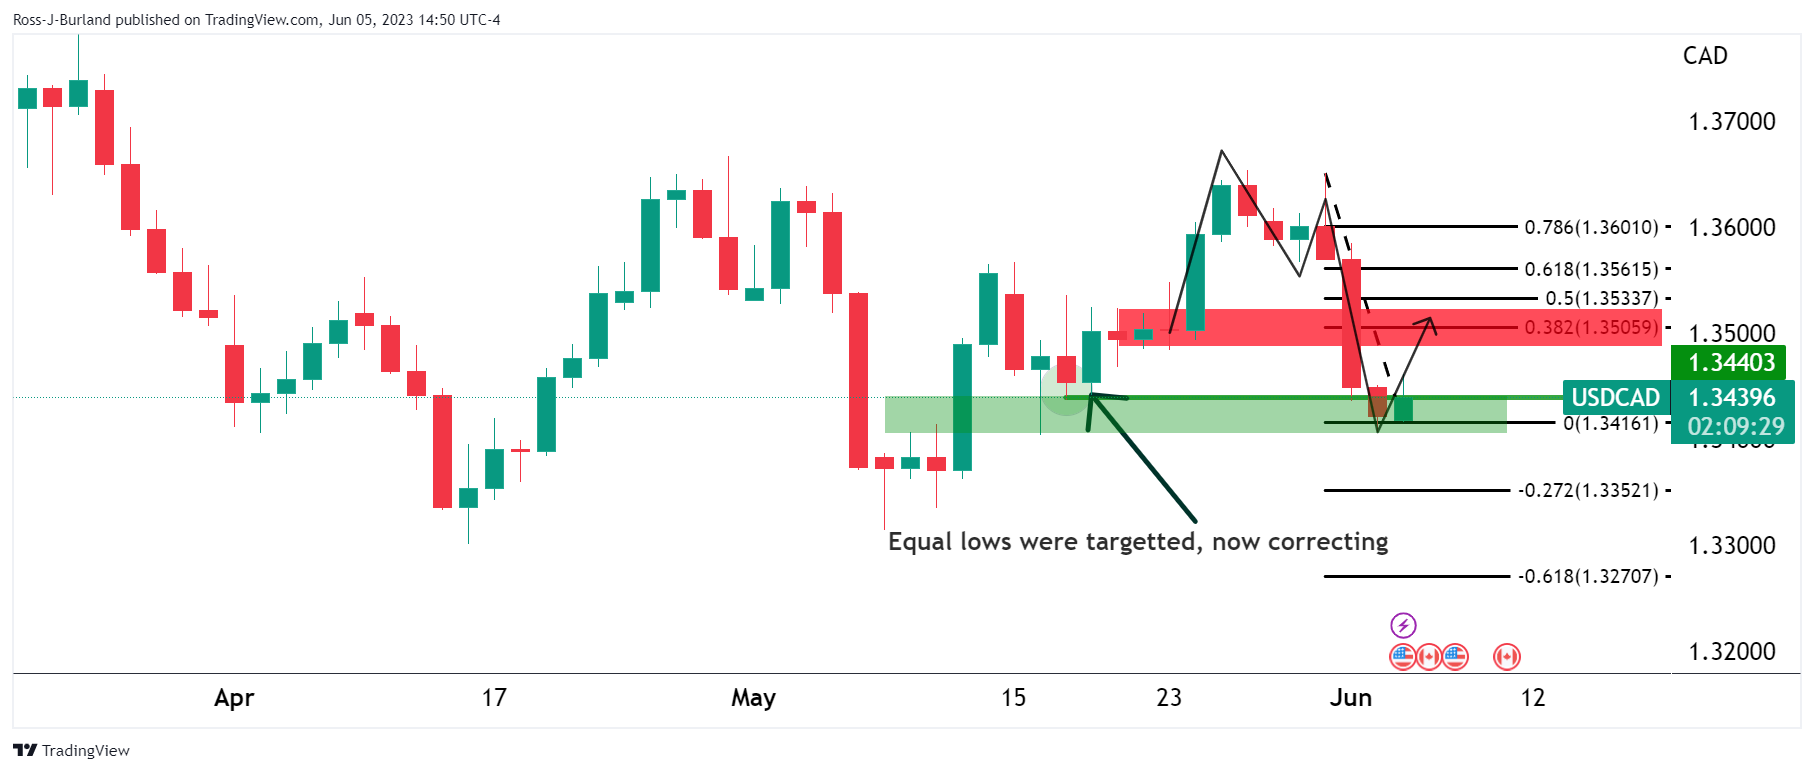
The market swept the matching lows and subsequently bulls entered at a discount at the end of the three-day slide. This has occurred while an M formation has been left on the charts. Bulls eye the Fibonacci scale, where the 38.2% ratio meets the previous structure and offers a compelling target for bulls.
1 hour chart
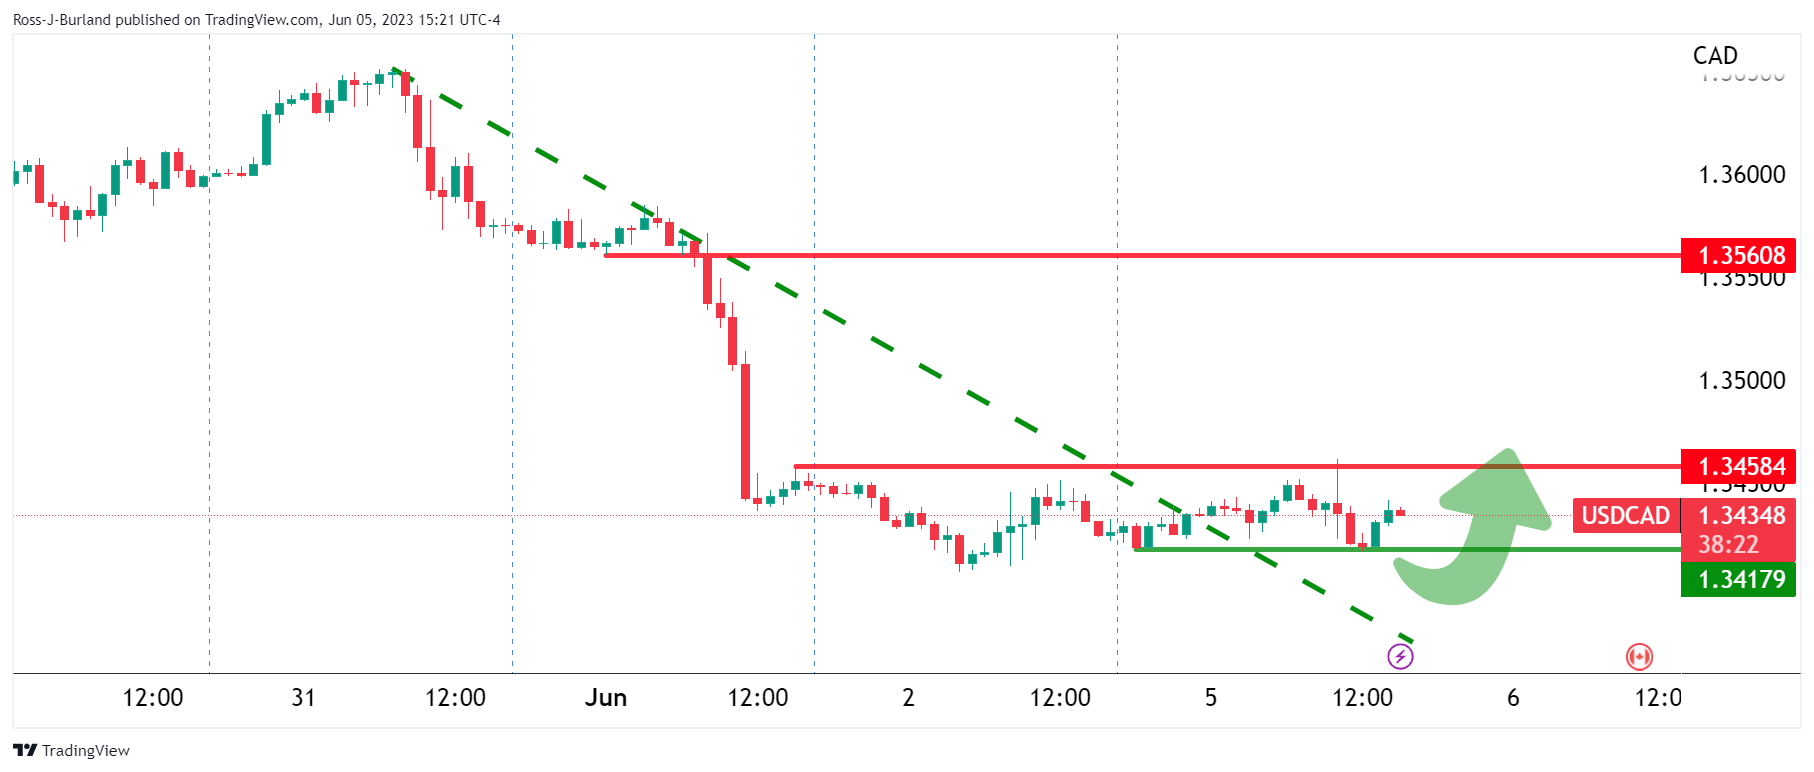
On the hourly chart, the price is sideways and the bulls need to break above 1.3460 to break the resistance structure. In doing so, there are prospects for a move through the 38.2% ratio to 1.3560.
Source: Fx Street
I am Joshua Winder, a senior-level journalist and editor at World Stock Market. I specialize in covering news related to the stock market and economic trends. With more than 8 years of experience in this field, I have become an expert in financial reporting.


