
- USD/CAD attracts some buyers near the 1.3360 zone, or the weekly low hit on Wednesday.
- A modest pullback in crude oil prices weakens the Loonie and lends the pair some support.
- A weaker risk tone benefits the USD’s safe-haven status and contributes to the intraday bounce.
The pair USD/CAD rebounds from weekly lows hit on Wednesday and rises to a new daily high, with bulls now looking to build momentum beyond 1.3400.
Crude Oil prices pared a major chunk of intraday gains to a one-week low, which, in turn, is seen undermining the commodity-linked Loonie. Furthermore, the risk-off state benefits the safe-haven dollar and helps the USD/CAD pair attract buyers near the 1.3360 zone.
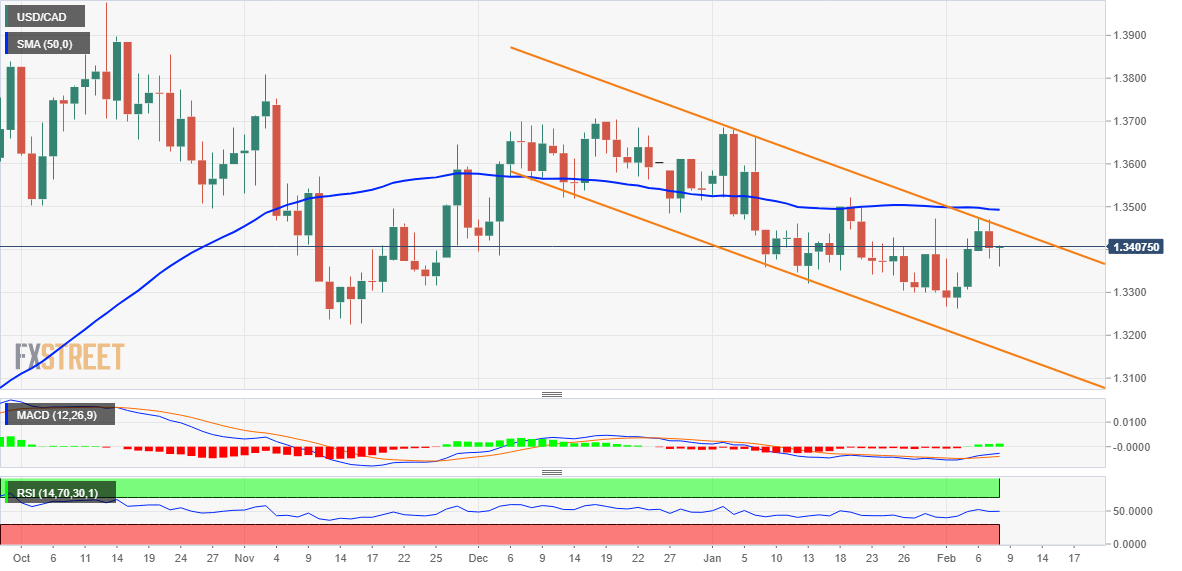
From a technical point of view, any further move higher could continue to face stiff resistance near the top of a descending channel that is more than two months old. This hurdle sits near the 1.3455 zone and is followed by last week’s swing high around the 1.3475 zone, which should now act as a key point.
Further sustained strength will be seen as a new trigger for bullish traders and set the stage for an extension of the recent rally move from the low since Nov 16. A follow-through buying beyond the 50-day SMA will reaffirm the positive bias and propel the USD/CAD pair beyond the key psychological 1.3500 level.
Momentum could extend towards a breakout of the technically significant 100-day SMA support, now turned resistance near the 1.3530 zone, above which bulls could aim to recapture the 1.3600 level.
On the opposite side, the daily low, around the 1.3360 area, now becomes immediate support to defend before 1.3300. A convincing break below will leave the USD/CAD pair vulnerable to fall below the yearly low around the 1.3265-1.3266 zone and test the 1.3200 mark on the way to channel support around the 1.3160-1.3155 zone.
USD/CAD daily chart
Key levels to watch
Source: Fx Street
I am Joshua Winder, a senior-level journalist and editor at World Stock Market. I specialize in covering news related to the stock market and economic trends. With more than 8 years of experience in this field, I have become an expert in financial reporting.


