
- USD/CAD broke two days of losses and rose towards 1.3350 on the release of US inflation data.
- The US Consumer Price Index for January was mixed, with MoM in line with estimates, while YoY numbers were above forecasts.
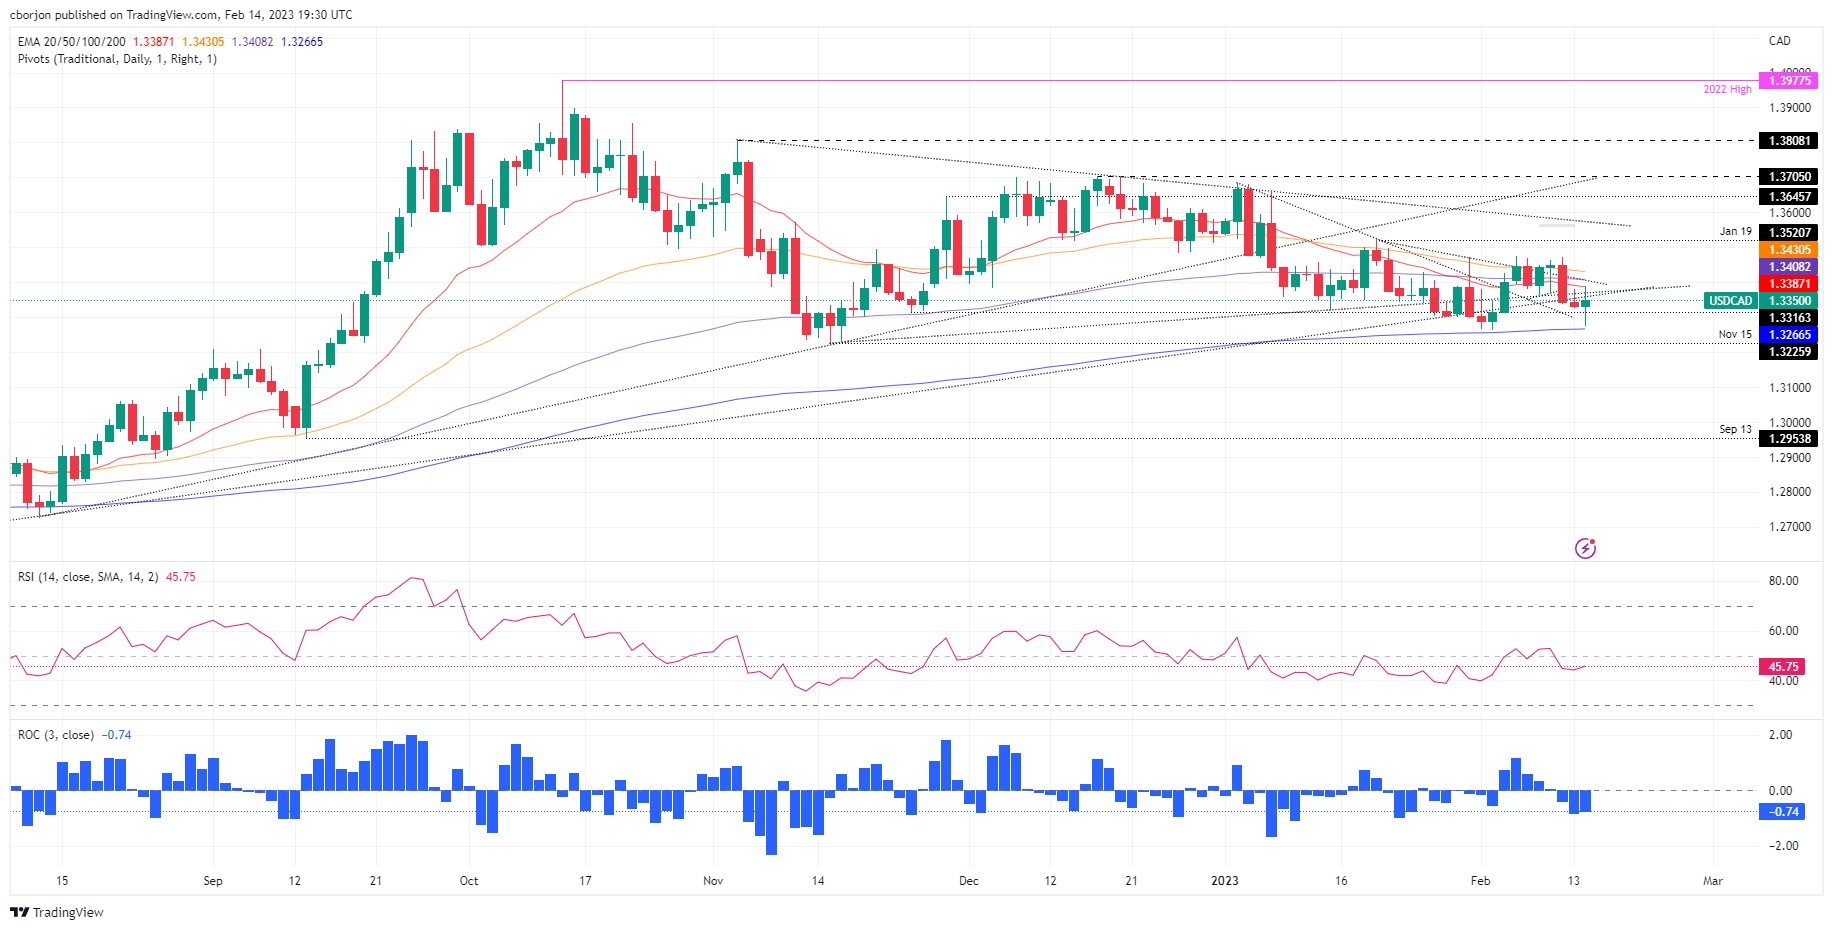
- USD/CAD Price Analysis: Prices Bullish as Bullish Engulfing Pattern Forms.
USD/CAD held on to its early gains for the day, but eased back after hitting a daily high of 1.3390 on reports that inflation had eased, albeit above forecasts. This increased the demand for the dollar, which has remained at supply levels, during the New York session. Therefore, the USD/CAD pair is trading at 1.3352 after hitting a low of 1.3273.
The US Bureau of Labor Statistics (BLS) reported that the January Consumer Price Index (CPI) rose 6.4% compared to the same period a year earlier, above the forecast rate of 6.2%. . Likewise, the core CPI increased by 5.6% year-on-year, above the estimated figure of 5.5%. The month-on-month data were in agreement with the predicted values.
After the publication of the report on inflation in the United States, several officials of the Federal Reserve (Fed) informed the media. Officials said the US central bank has not finished raising rates, while stressing that inflation is high and more tightening is needed. They stressed that their playbook is “higher for longer” and they do not expect to cut rates in 2023.
Against this background, USD/CAD remained in the lead and was bolstered by falling US crude oil prices, with WTI slipping 1.53%. Money market futures estimate that the Federal Reserve will raise rates above the 5% threshold, expecting the first rate cut in December 2023.
Apart from this, although the Bank of Canada is expected to hike rates further, the interest rate differential between the two countries would benefit the US dollar (USD). Therefore, further rises are expected in the USD/CAD pair.
What must be considered?
Housing and manufacturing data will be published on the Canadian agenda. In the United States, Retail Sales, the New York Fed Manufacturing Index and Industrial Production will be published.
USD/CAD Technical Analysis
The USD/CAD daily chart suggests a bullish reversal is in the making as Tuesday’s price action is engulfing the previous day’s. Therefore, a bullish engulfing candlestick pattern could open the door for further gains, although solid resistance remains. The 20-day EMA around 1.3386 would be the bears’ first line of defense. A break of the latter and 1.3400 is in play, closely followed by the 100 and 50 day EMAs each at 1.3408 and 1.3430.
Source: Fx Street
I am Joshua Winder, a senior-level journalist and editor at World Stock Market. I specialize in covering news related to the stock market and economic trends. With more than 8 years of experience in this field, I have become an expert in financial reporting.


