
- DXY retraces part of Friday’s strong advance and is back below 113.00.
- The index appears to have entered a consolidation at 112.00-114.00.
The US Dollar Index (DXY) is under moderate selling pressure and falls back below 113.00 on Monday.
The index looks poised to navigate within a range of 112.00-114.00 at least in the very short term, ie until the next FOMC event.
Prospects for additional dollar gains should not change as long as the index trades above the 8-month support line near 108.00.
In the longer term, DXY is expected to maintain its constructive stance as long as it is above the 200-day SMA at 103.35.
DXY daily chart
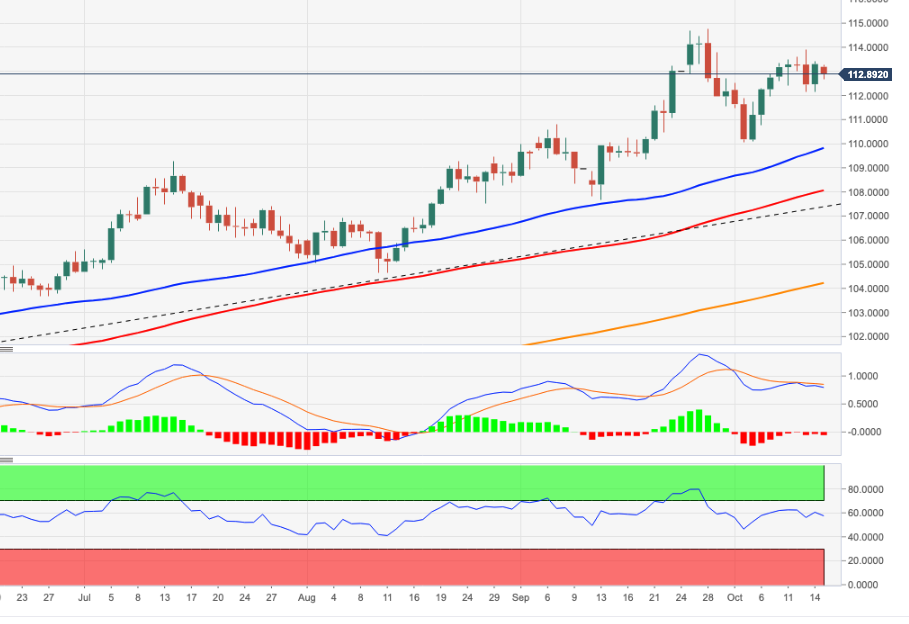
Source: Fx Street
With 6 years of experience, I bring to the table captivating and informative writing in the world news category. My expertise covers a range of industries, including tourism, technology, forex and stocks. From brief social media posts to in-depth articles, I am dedicated to creating compelling content for various platforms.


