
- The DXY maintains the bullish tone and advances above 104.60.
- Further gains could extend to the 200-day SMA near 105.60.
He DXY adds to Tuesday’s advance and hits new multi-week highs in the 104.60/65 zone on Wednesday.
In the short term, additional gains are anticipated. That being said, the breach of the May high at 104.63 (May 31) should put a possible visit to the key 200-day SMA back on the radar today at 105.63 ahead of the 2023 high at 105.88 (March 8). .
Overall, as long as it stays below the 200-day SMA, the outlook for the index will remain negative.
DXY daily chart
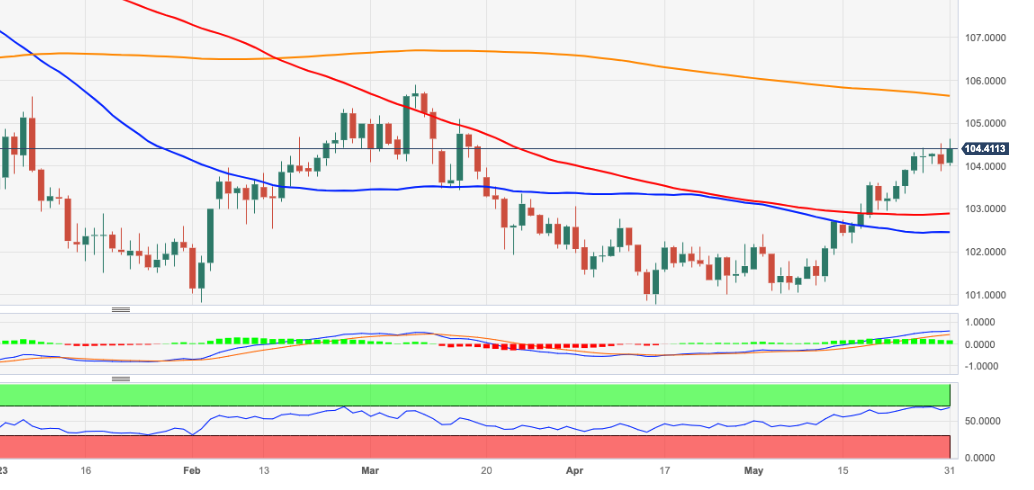
Source: Fx Street
I am Joshua Winder, a senior-level journalist and editor at World Stock Market. I specialize in covering news related to the stock market and economic trends. With more than 8 years of experience in this field, I have become an expert in financial reporting.


