
- The DXY adds to Tuesday’s move lower and faces 102.00.
- Next, to the downside, is the April low near 101.40.
The US Dollar Index (DXY) remains under pressure and tests the 102.00 zone on Wednesday, adding to the negative price action seen in the previous session.
A daily close below 102.00 could open the door for a deeper pullback to initially the April low at 101.43 (April 5), while a break of this level could expose a move to the 2023 low around at 100.80 (February 2).
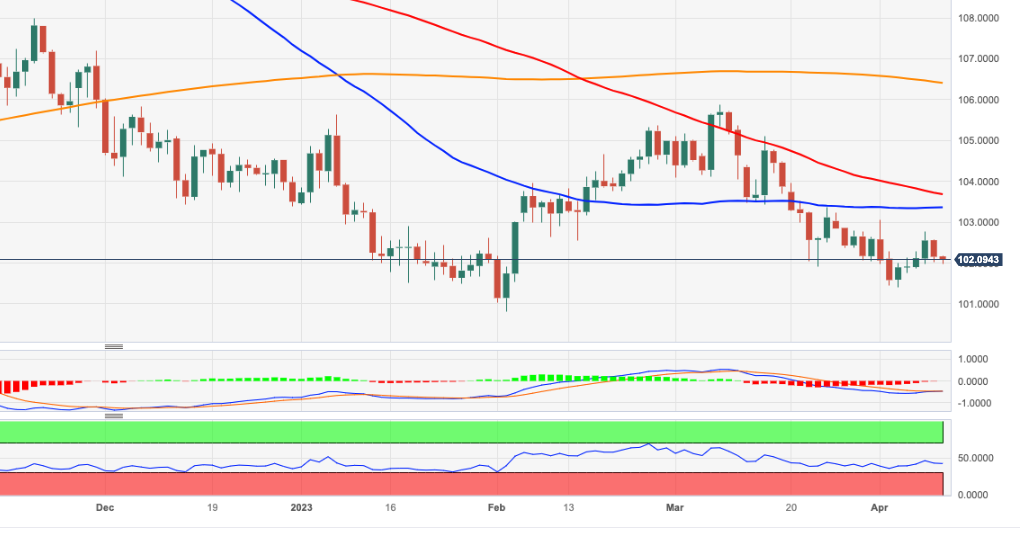
On a bigger picture, as long as it holds below the 200-day SMA, today at 106.42, the outlook for the index is expected to remain negative.
DXY daily chart
Source: Fx Street
I am Joshua Winder, a senior-level journalist and editor at World Stock Market. I specialize in covering news related to the stock market and economic trends. With more than 8 years of experience in this field, I have become an expert in financial reporting.


