
- The index maintains erratic activity around 103.00 so far.
- The monthly high near 104.00 continues to limit the upside.
The US Dollar Index (DXY) reverses the recent 2-day pullback and recaptures the 103.60 area on Wednesday.
The ongoing price action leaves the door open for a continuation of the consolidative tone for now. However, occasional bouts of strength are expected to remain limited by the proximity of the 104.00 area, or February highs (Feb 7).
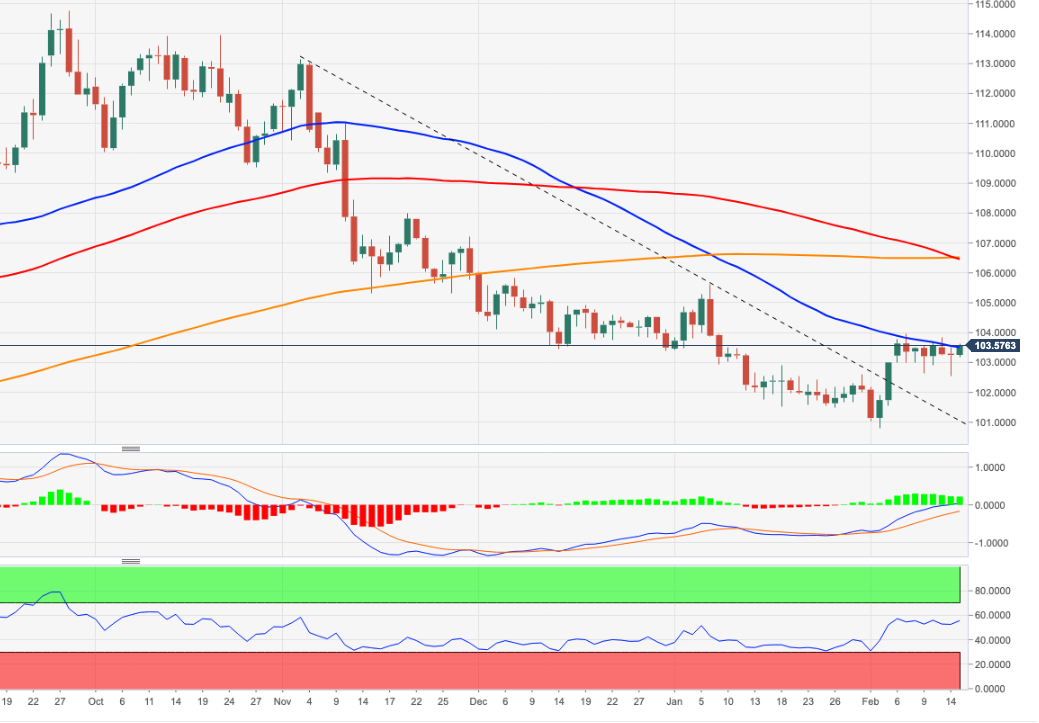
Longer-term, as long as it remains below the 200-day SMA at 106.45, the outlook for the index remains negative.
DXY daily chart
Source: Fx Street
I am Joshua Winder, a senior-level journalist and editor at World Stock Market. I specialize in covering news related to the stock market and economic trends. With more than 8 years of experience in this field, I have become an expert in financial reporting.


