
- The index extends its advance beyond 104.00.
- Additional gains are now targeting the yoy high at 105.63.
The bullish momentum gains more strength and raises the DXY to fresh monthly highs near 104.70 on Friday.
For the moment, the evolution of prices favors the continuation of the upward trend. Further bouts of strength are now expected to put a possible test of the 2023 high at 105.63 (Jan 6) back on investors’ radar in the not too distant future.
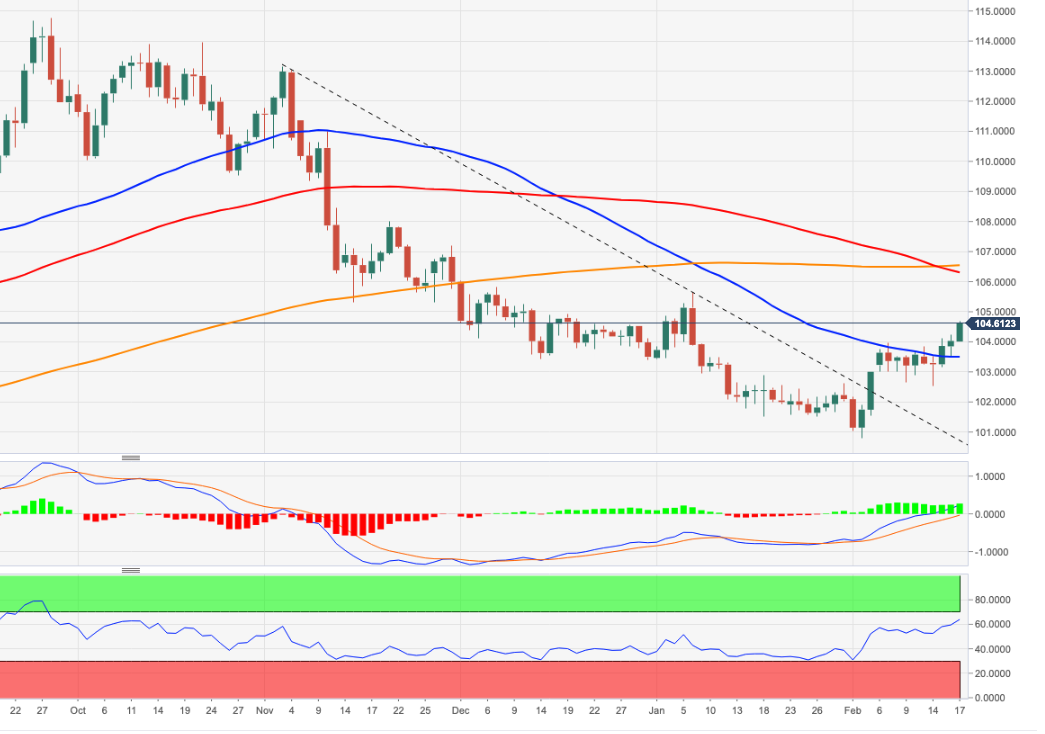
Longer-term, as long as it remains below the 200-day SMA at 106.44, the outlook for the index remains negative.
DXY daily chart
Source: Fx Street
I am Joshua Winder, a senior-level journalist and editor at World Stock Market. I specialize in covering news related to the stock market and economic trends. With more than 8 years of experience in this field, I have become an expert in financial reporting.


