
- The DXY leaves behind Monday’s decline to the 104.50/40 area.
- Further recovery shifts attention towards the 105.00 barrier.
The DXY puts Monday’s bearish behavior aside and hopes to revisit the key 105.00 zone on Tuesday.
The continuation of the multi-week rally looks strong and a break of 105.00 should encourage the index to retest the September high of 105.15 (September 7) before the 2023 high of 105.88 (March 8).
As long as it remains above the key 200-day SMA, today at 103.02, the outlook for the index is expected to remain constructive.
DXY Daily Chart
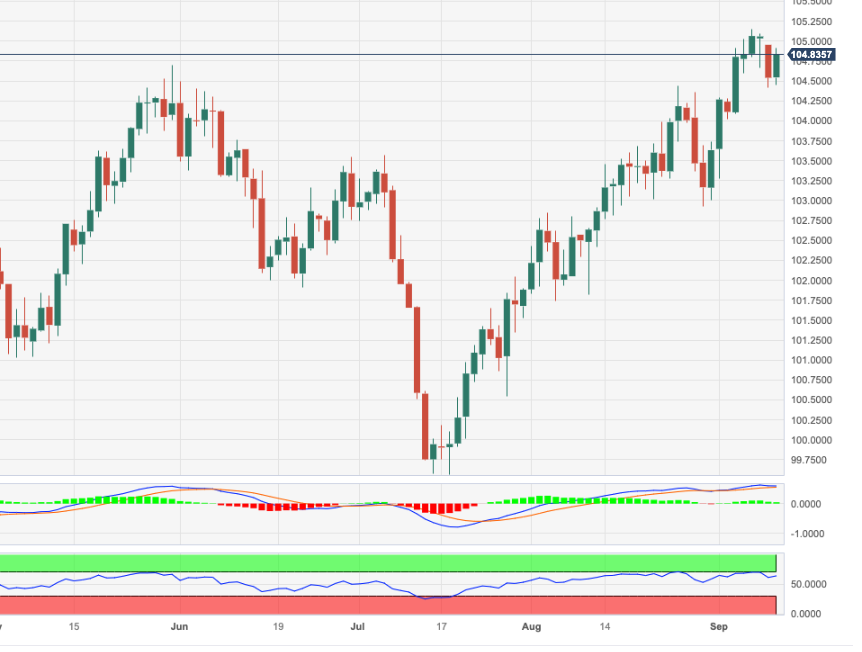
Source: Fx Street
I am Joshua Winder, a senior-level journalist and editor at World Stock Market. I specialize in covering news related to the stock market and economic trends. With more than 8 years of experience in this field, I have become an expert in financial reporting.


