
- The DXY looks offered and returns to the 103.00 zone before the Fed.
- The loss of 103.00 could trigger a deeper correction in the short term.
The US dollar index (DXY) extends the weekly leg lower and retests the 103.00 area, where some containment appears to have emerged thus far.
For the moment, the bearish mood has not abated. Against this, there is minor support at the weekly low of 102.58 (Feb 14), while a loss of this zone could trigger further losses to the 2023 low near 101.80 (Feb 2).
On a bigger picture, as long as it holds below the 200-day SMA, today at 106.61, the outlook for the index is expected to remain negative.
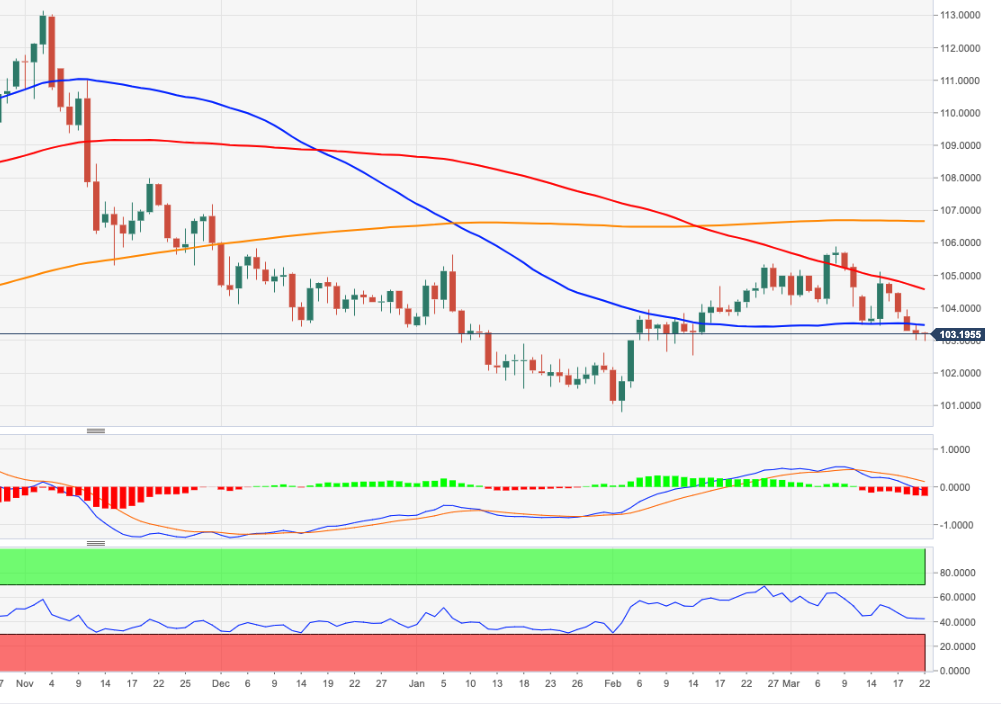
DXY daily chart
Source: Fx Street
I am Joshua Winder, a senior-level journalist and editor at World Stock Market. I specialize in covering news related to the stock market and economic trends. With more than 8 years of experience in this field, I have become an expert in financial reporting.


