
- The US Dollar is moving sideways ahead of a very important data release on Thursday.
- Markets remain concerned about headwinds in Europe and the Nvidia subpoena.
- The US Dollar Index is retreating and flirting with a break below 101.00.
The US Dollar (USD) is trading weaker on Thursday, with many data points due for release in a short period of time. The Dollar already weakened following the JOLTS job openings report on Wednesday, when the previous number was revised and the recent figure for July came in below the estimate. It was enough for markets to price in more rate cuts by the Federal Reserve (Fed) and devalue the US Dollar due to the narrowing of the interest rate gap between the US and other countries.
As for economic data, it will be up to experienced traders to navigate the set of data due to be released on Thursday in the markets. Highlights include the ADP monthly employment change for private payrolls and the weekly initial/continuing jobless claims, which will move the US dollar. Also of note is the Institute for Supply Management (ISM) Services Purchasing Managers’ Index (PMI) data.
Market Movers Daily Wrap-Up: Navigating the Data
- At 11:30 GMT, Challenger’s job cuts for August will be published. The previous number was 25,885.
- At 12:15 GMT, the ADP Employment Change for August will hit the markets. It is expected to rise to 145,000 from the previous figure of 122,000.
- At 12:30 GMT, weekly jobless claims data will be released.
- Initial claims are expected to remain stable at 230,000 for the week ending August 30, up from 231,000 the previous week.
- Continuing claims are expected to edge up to 1.87 million for the week of August 23 from 1.868 million.
- Following the weekly jobless claims, monthly nonfarm productivity and unit labor costs for the second quarter will be released. For nonfarm productivity, a steady increase of 2.3% is expected, while unit labor costs should remain at 0.9%.
- At 13:45 GMT, S&P Global will deliver its final reading for the August Composite and Services PMI numbers. Services is expected to remain flat at 55.2, and the Composite is expected to hold at the previous reading of 54.1.
- The Institute for Supply Management (ISM) will close the batch of data this Thursday at 14:00 GMT with its August reading for the services sector:
- The headline PMI number is expected to come in at 51.1, down from 51.4 in July.
- The Employment Index was at 51.1 last month, with no forecast available.
- The New Orders Index was at 52.4 in July, with no forecast available.
- The Prices Paid Index was at 57, with no forecast.
- Shares are floating in the wreckage after the hit they took following the correction of NVIDIA (NVDA) after the company received a subpoena from the U.S. Department of Justice for violating antitrust laws. All major indexes are in the red, though overall down less than 1%.
- The CME Fedwatch tool shows a 55.0% chance of a 25 basis point (bp) interest rate cut by the Fed in September versus a 45.0% chance of a 50 bp cut. Another 25 bp cut (if September is a 25 bp cut) is expected in November with a 30.2% chance, while there is a 49.5% chance of rates being 75 bp (25 bp + 50 bp) below current levels and a 20.3% chance of rates being 100 (25 bp + 75 bp) basis points lower.
- The US 10-year benchmark rate is trading at 3.76%, the lowest level this week.
Dollar Index Technical Analysis: That Doesn’t Look Good
The US Dollar Index (DXY) appears to be stuck in a tight range, remaining there for now after Tuesday’s data failed to move the needle. With the JOLTS jobs openings report due on Wednesday, the assumption is the same: any number that is substantially above or below consensus will move the DXY in either direction. Meanwhile, markets are placing a higher probability on a 50 basis point rate cut by the Fed this month.
The first resistance at 101.90 is starting to look very difficult to overcome after it already triggered a rejection earlier this week. Further up, a sharp 2% rise would be needed to take the index to 103.18. Finally, a strong resistance level near 104.00 not only has crucial technical value but also carries the 200-day simple moving average (SMA) as the second heavyweight to limit price action.
On the downside, 100.62 (the low of December 28) could soon see a test should data support further rate cuts by the US Federal Reserve (Fed). If broken, the July 14, 2023 low of 99.58 will be the definitive level to watch. Once that level gives way, early 2023 levels will come in near 97.73.
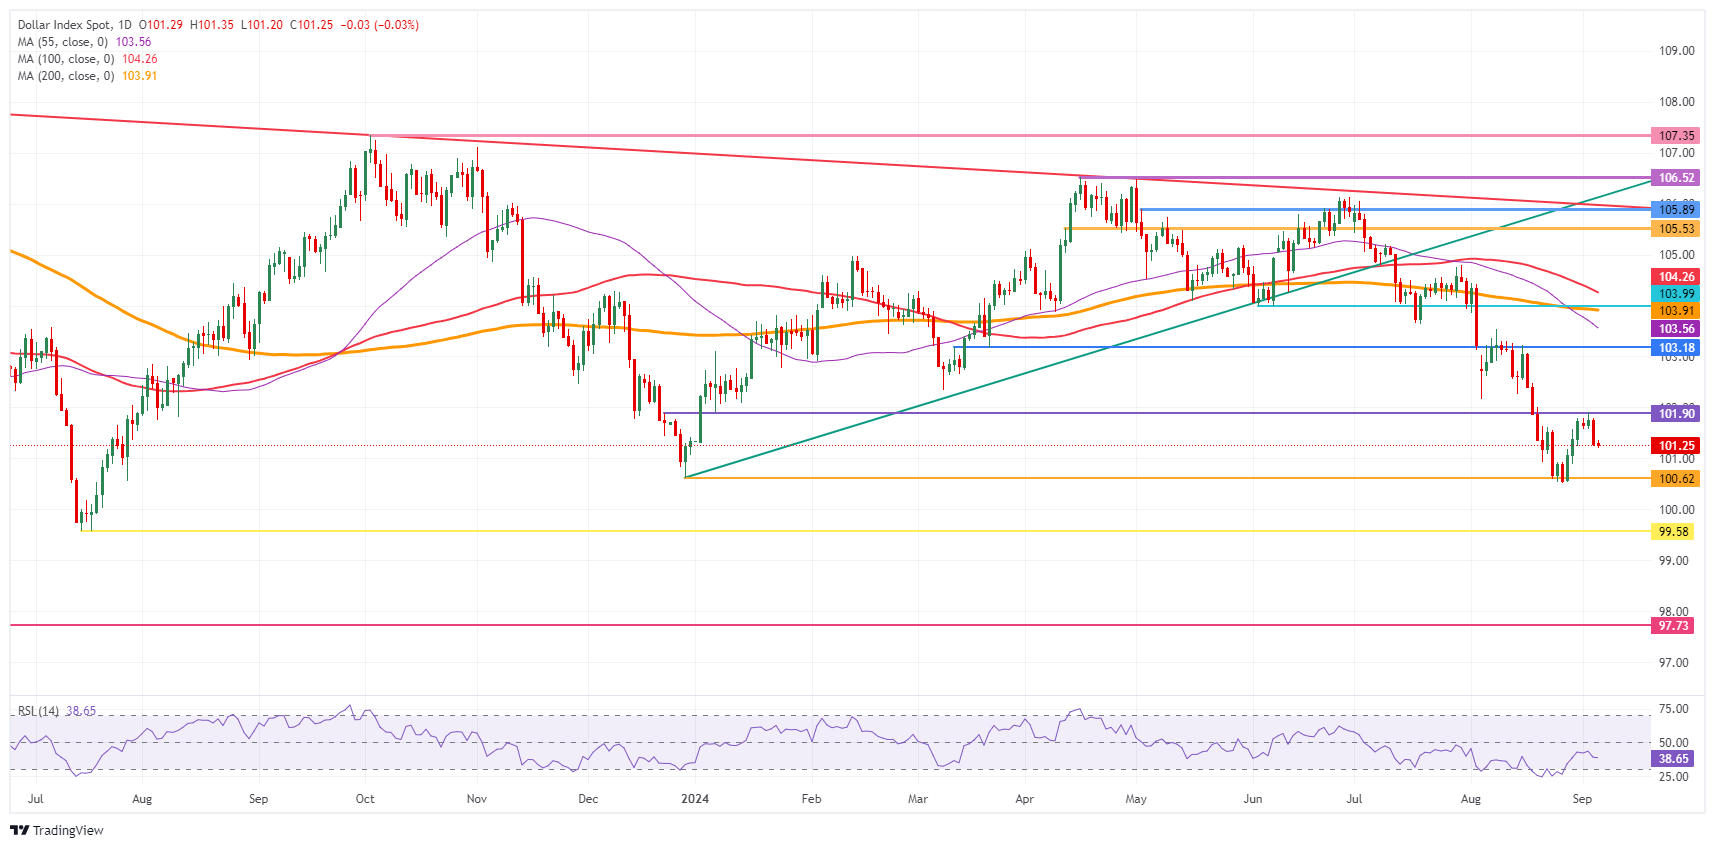
Dollar Index: Daily Chart
US Dollar FAQs
The United States Dollar (USD) is the official currency of the United States of America, and the de facto currency of a significant number of other countries where it is in circulation alongside local banknotes. As of 2022, it is the most traded currency in the world, accounting for over 88% of all global foreign exchange transactions, equivalent to an average of $6.6 trillion in daily transactions. Following World War II, the USD took over from the British Pound as the world’s reserve currency.
The single most important factor influencing the value of the US dollar is monetary policy, which is determined by the Federal Reserve (Fed). The Fed has two mandates: to achieve price stability (control inflation) and to promote full employment. Its main tool for achieving these two goals is to adjust interest rates. When prices rise too quickly and inflation exceeds the Fed’s 2% target, the Fed raises rates, which helps the dollar. When inflation falls below 2% or the unemployment rate is too high, the Fed can lower interest rates, which weighs on the dollar.
In extreme situations, the Federal Reserve can also print more dollars and enact quantitative easing (QE). QE is the process by which the Fed substantially increases the flow of credit in a jammed financial system. It is an unconventional policy measure used when credit has dried up because banks are not lending to each other (for fear of counterparty default). It is a last resort when simply lowering interest rates is unlikely to achieve the necessary result. It was the Fed’s weapon of choice to combat the credit crunch that occurred during the Great Financial Crisis of 2008. It involves the Fed printing more dollars and using them to buy US government bonds, primarily from financial institutions. QE typically leads to a weakening of the US dollar.
Quantitative tightening (QT) is the reverse process whereby the Federal Reserve stops buying bonds from financial institutions and does not reinvest the principal of maturing securities in new purchases. It is generally positive for the US dollar.
Source: Fx Street
I am Joshua Winder, a senior-level journalist and editor at World Stock Market. I specialize in covering news related to the stock market and economic trends. With more than 8 years of experience in this field, I have become an expert in financial reporting.


