
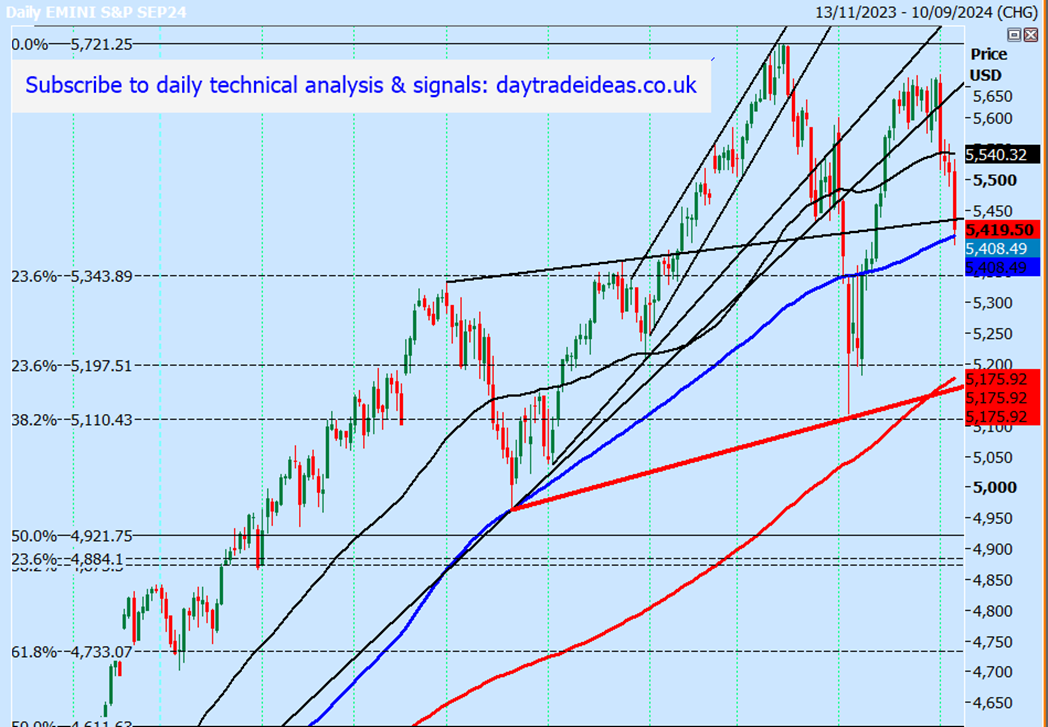
September Emini S&P futures are lower on the important data.
Note that we closed below the 100-day moving average at 5408
The low and high of the last session were 5394 – 5532.
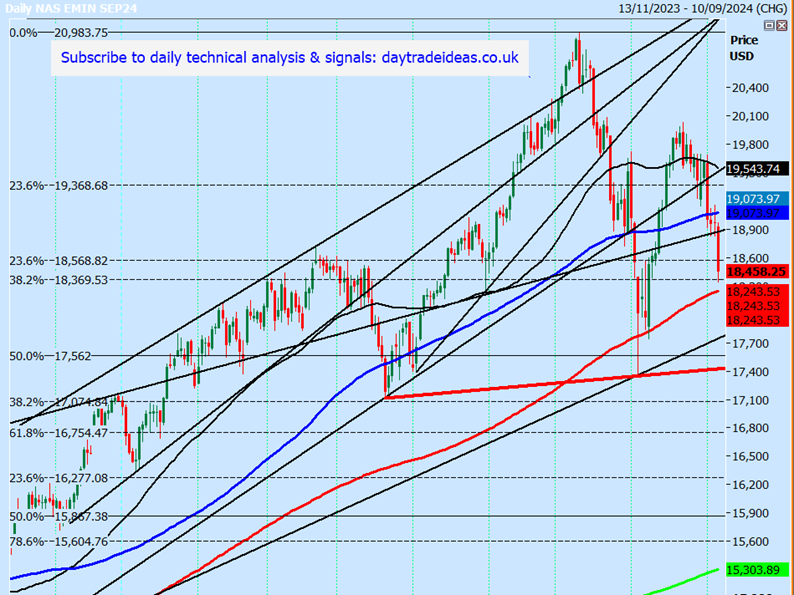
The September Emini Nasdaq collapsed to 18340
High and low of the last session for the SEPTEMBER futures contract: 18340 – 18972.
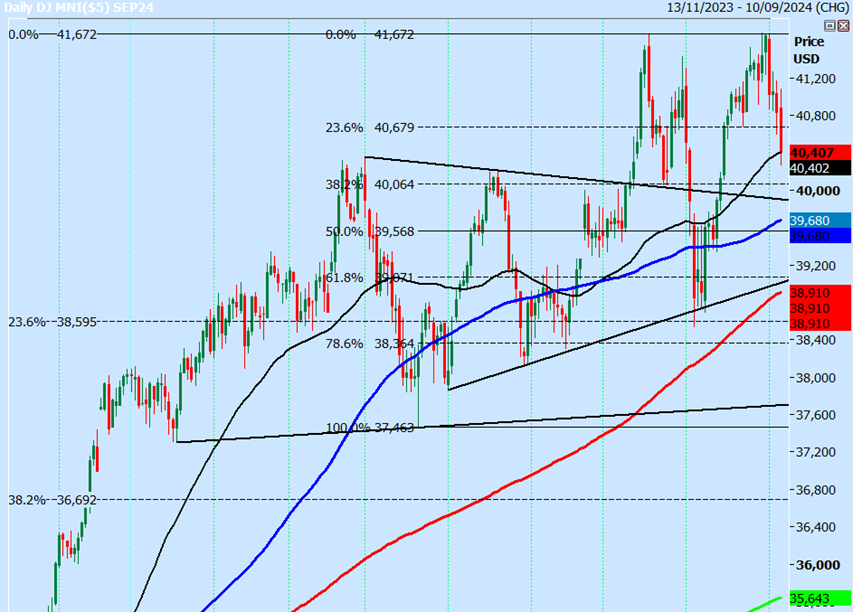
The September Emini Dow Jones has a possible double top sell signal after the breakdown from the new all-time high at 41682 and on Friday we dropped to 40264.
High and low of the last session for the SEPTEMBER futures contract: 40264 – 41080.
September Emini S&P Futures
The Emini S&P broke the best support at 5470/60 while it seems likely that we will form that right shoulder.
The path of least resistance appears to be down, with weak employment numbers triggering losses on Friday.
Two months ago that would have triggered strong gains on speculation of deep interest rate cuts, but now it seems the market is becoming more concerned about the economy. Therefore, further losses are likely this week unless we start to see more solid economic data.
Core inflation and CPI are due on Wednesday, so a higher-than-expected number would likely be catastrophic for stock markets.
I think shorts are the safest bet, with resistance at 5455/65 and shorts need stops above 5575.
Resistance again at 5495/5505 and shorts need stops above 5515.
A break below 5390 (Friday low was 5494) targets 5370 and support at 5350/45.
Please note that even if we are building a downtrend (and I think we are) there will be very strong bounces off support levels.
Bulls never give up and buying the dip has worked for too long for them to stop now!!
Nasdaq September Futures
I have been watching and noticing the formation of a right shoulder in a 6 month head and shoulders pattern and this is developing well.
We broke support at 18880/18830 this time for another sell signal which points to strong Fibonacci support at 18600/500 but we overshot it to 18340
Holding below 18550/600 keeps the pressure on for further losses with a break below the 200-day moving average at 18250/200 expected to trigger losses up to 17980/950 and 17850/800.
Gains are likely to be limited with minor resistance at 18700/750 and strong resistance at 18850/950. Shorts need stops above 19000.
September Emini Dow Jones Futures
It broke short-term support at 40700/650 for a sell signal targeting 40400/350 and perhaps as high as 40100 on Monday.
We found minor support at 40000/39900 but I think longs are too risky.
A break below 39900 is another sell signal targeting 39700/660 and 39370/340.
Again, gains are likely to be limited with resistance at 40580/660 and shorts need stops above 40750.
Source: Fx Street
I am Joshua Winder, a senior-level journalist and editor at World Stock Market. I specialize in covering news related to the stock market and economic trends. With more than 8 years of experience in this field, I have become an expert in financial reporting.


