
- The three main US stock indices sink between 0.29% and almost 2%.
- Risk aversion dominates Monday’s session, due to fears of the quagmire in China and high inflation that reduces corporate profits before the results session arrives.
- The Fed’s George worried that faster rates would hurt the economy.
- The Fed’s Bullard said the US economy is strong and can withstand higher rates.
US stocks broke five consecutive days of gains, trading lower on Monday, courtesy of risk aversion and fears that earnings may miss expectations due to the deteriorating economic outlook, which fueled the appetite for safe-haven assets .
At the time of writing, the S&P 500 stands at 3,863.20, down 0.93%, while the tech-heavy Nasdaq is down 1.86% to 11,420.73. For its part, the Dow Jones Industrials fell 0.29% and stood at 31,246.41.
As for the sectors, the most notable is public services, which rose 0.37%, followed by real estate and health, which registered gains of 0.20% and 0.02%, respectively. As appetite for riskier assets diminished, the biggest losers were communication services, consumer discretionary and technology, which tumbled 2.59%, 2.31% and 0.96% each.
Stocks fell on renewed concern over a resurgence of China’s Covid-19 and falling commodity prices. US companies will start the earnings season at the end of the week, which could indicate a high impact of inflation on companies. The US economic calendar will reveal consumer and producer inflation, US retail sales and consumer sentiment from the University of Michigan (UoM).
Meanwhile, Fed members made some comments, led by Kansas City Fed President Esther George, who said “moving rates too quickly raises the prospect of overshooting.” George said she agreed to raise rates faster to dampen inflation, although she expressed concern that it could hurt the economy. Later, St. Louis Fed President James Bullard reiterated that the US economy is strong and can withstand higher rates, while backing a 75 basis point rate hike for the July meeting.
The dollar index (DXY), which measures the value of the USD against some currencies, rose 1.04% to 108,003, while the 10-year US Treasury yield lost some ground, falling nine basis points, trading at 2,993. %.
Benchmark oil in the US commodity complex, WTI, falls 0.70%, changing hands at $104.05 BPD. For its part, precious metals such as gold (XAU/USD) fell 0.47%, trading at $1,734.20 a troy ounce.
SP 500 Chart
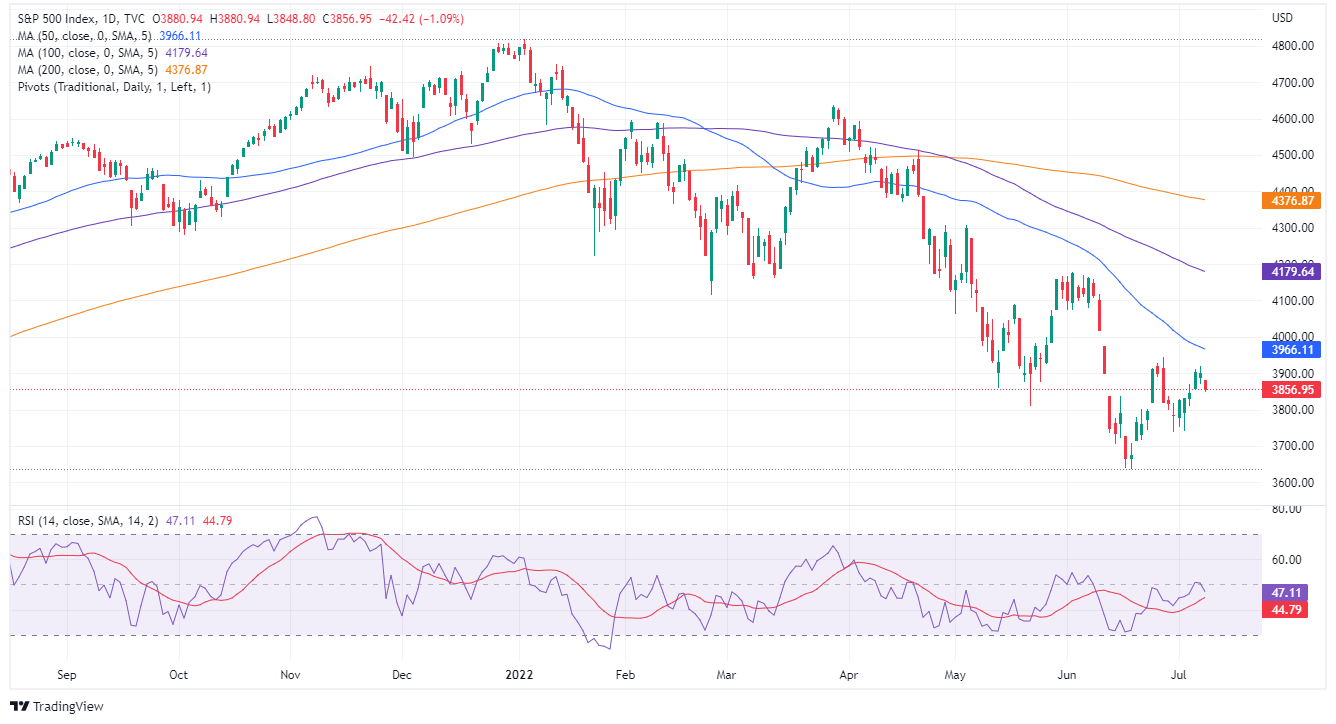
Technical levels
Source: Fx Street
With 6 years of experience, I bring to the table captivating and informative writing in the world news category. My expertise covers a range of industries, including tourism, technology, forex and stocks. From brief social media posts to in-depth articles, I am dedicated to creating compelling content for various platforms.


