
- The price of Gold is correcting lower after hitting an all-time high of $2,450 on Monday.
- The decline appears to be due to central banks' reluctance to lower interest rates.
- The bearish divergence on the daily chart could indicate a deeper correction.
The price of Gold (XAU/USD) retreats to $2,420 on Tuesday as comments from central bank policymakers around the world reveal a reluctance to commit to lowering interest rates. The precious metal tends to perform poorly in a higher interest rate environment due to the returns investors can earn by staying in cash or bonds.
However, persistent geopolitical concerns arising from conflicts in the Middle East and Ukraine are acting as a positive counterweight to the price of Gold. Hoarding of gold by emerging markets and the central banks of the BRICS countries as an insurance policy against Western sanctions, which usually affect US Dollar (USD) or Euro (EUR) reserves, is another supporting factor.
The price of Gold falls after the change in interest rate outlook
The price of Gold retreats on Tuesday after the central bankers of the US and Australia not only refuse to commit to lowering interest rates, but also discuss the possibility of raising them.
On Monday, Federal Reserve Bank of Cleveland President Loretta Mester said the Fed could “even raise (rates)” if inflation rose, and that it was “no longer appropriate” to expect the Fed to make three cuts. this year.
On Tuesday morning, the Reserve Bank of Australia (RBA) published the minutes of its May meeting, revealing that the board of governors had discussed raising interest rates. It was the first time in many months that they had talked about tightening monetary policy.
Technical analysis: Gold price retreats, RSI diverges
The price of Gold (XAU/USD) has retreated from all-time highs around $2,450 on Tuesday after forming a Shooting Star candlestick pattern on Monday. This candlestick pattern occurs when the price reaches a new high and then pulls back to close near its low. It is a bearish signal after an uptrend, especially when it is followed by a bearish red candlestick the next day, as is the case currently. If Tuesday ends as a bearish red day, it could be a sign of a deeper correction to come.
However, if Tuesday ends as a bullish green day, the significance of the shooting star will be reduced and could be a sign that the dominant uptrend is more likely to continue.
XAU/USD Daily Chart
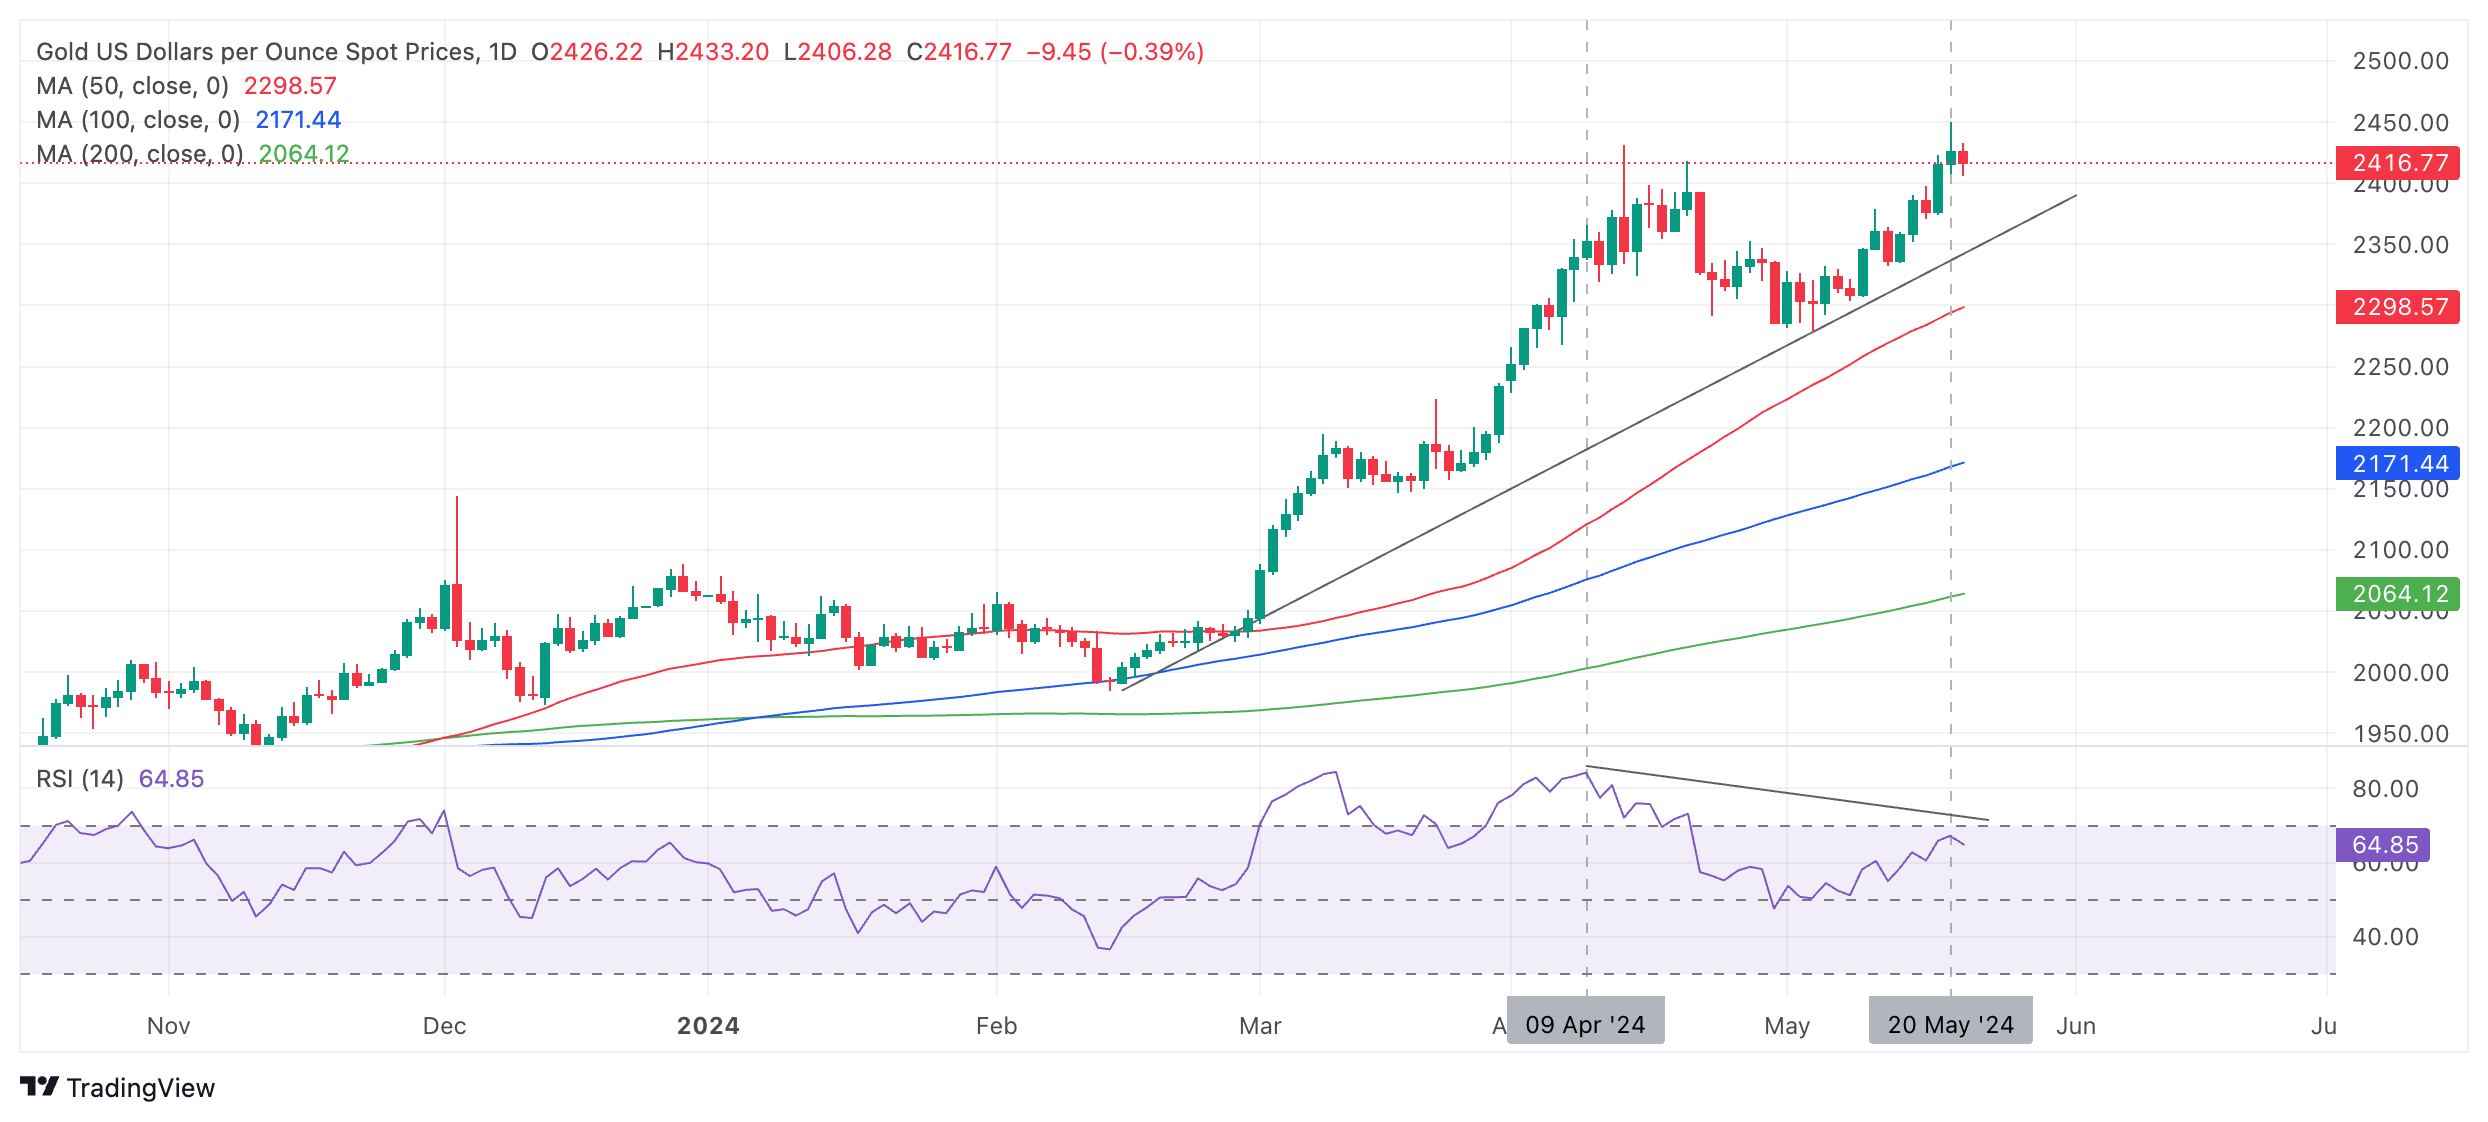
The RSI shows a sharp bearish divergence with price on the daily chart, providing further evidence that a correction may be about to develop. Even though the price of Gold broke through the April 12 high to make a higher high on May 20, the RSI failed to make a higher high. This is a bearish indication, suggesting a higher probability of a pullback.
If a correction occurs, Gold will likely fall to the uptrend line support at $2,360.
However, the precious metal's short, medium and long-term trends are bullish, and given the old adage that “the trend is your friend”, the odds favor an eventual recovery even if a correction occurs.
If it breaks above the new all-time high of $2,450, the rally is likely to continue towards the next target, the psychologically significant $2,500 level.
Source: Fx Street
I am Joshua Winder, a senior-level journalist and editor at World Stock Market. I specialize in covering news related to the stock market and economic trends. With more than 8 years of experience in this field, I have become an expert in financial reporting.


