
- The Dow Jones rises 0.06% on Tuesday.
- The Nasdaq 100 falls 0.72% daily, dragged by Applovin (APP).
- The S&P 500 loses 0.37% today after the US ISM Services PMI.
The Dow Jones set a daily low of 42,651, finding buyers that took the index to a daily high of 42,910.
The Dow Jones Industrial Average began trading at 42,687, while the Nasdaq 100 technology index began trading at 21,544. The S&P 500 opened at 5,967, marking its third consecutive day higher.
Walt Disney and IBM lead Dow Jones gains
The Dow Jones stock index is trading at 42.728 at the time of writing, gaining 0.06% today, in line with the main stock indices.
International Business Machines (IBM) shares are up 0.22% on the day, hitting nearly three-week highs not seen since December 20 at $226.70. Following the same trend, Walt Disney shares (DIS) gained 1.67% daily, reaching December 18 highs of $113.73, leading the gains in the Dow Jones.
The Nasdaq 100 is trading in negative territory weighed down by Applovin and Microstrategy Incorporated
The Nasdaq 100 technology index posts losses today, falling 0.72% on the day, currently trading above 21,392.
Applovin (APP) values plummeted 8.78% today, signing its consecutive downward session, reaching the lows of January 2 at 322.52. In the same vein, Microstrategy Incorporated (MSTR) shares lose 6.87%, trading at $356.00 at the time of writing.
S&P 500 trades lower after US ISM services PMI
The S&P 500 index fell 0.37% today, consolidating within the previous session’s operating range at 5,952.
The US Institute of Supply Management (ISM) placed the December services PMI at 54.1 points, exceeding the previous and estimated 52.1 and 53.3, respectively.
The JOLTS job openings survey recorded 8.098 million positions in November, above the 7.7 million estimated and the 7.839 million previously recorded.
Traders will focus their attention tomorrow on the ADP employment report and the FOMC Minutes, where they will look for clues that will define the Fed’s monetary policy in the short term.
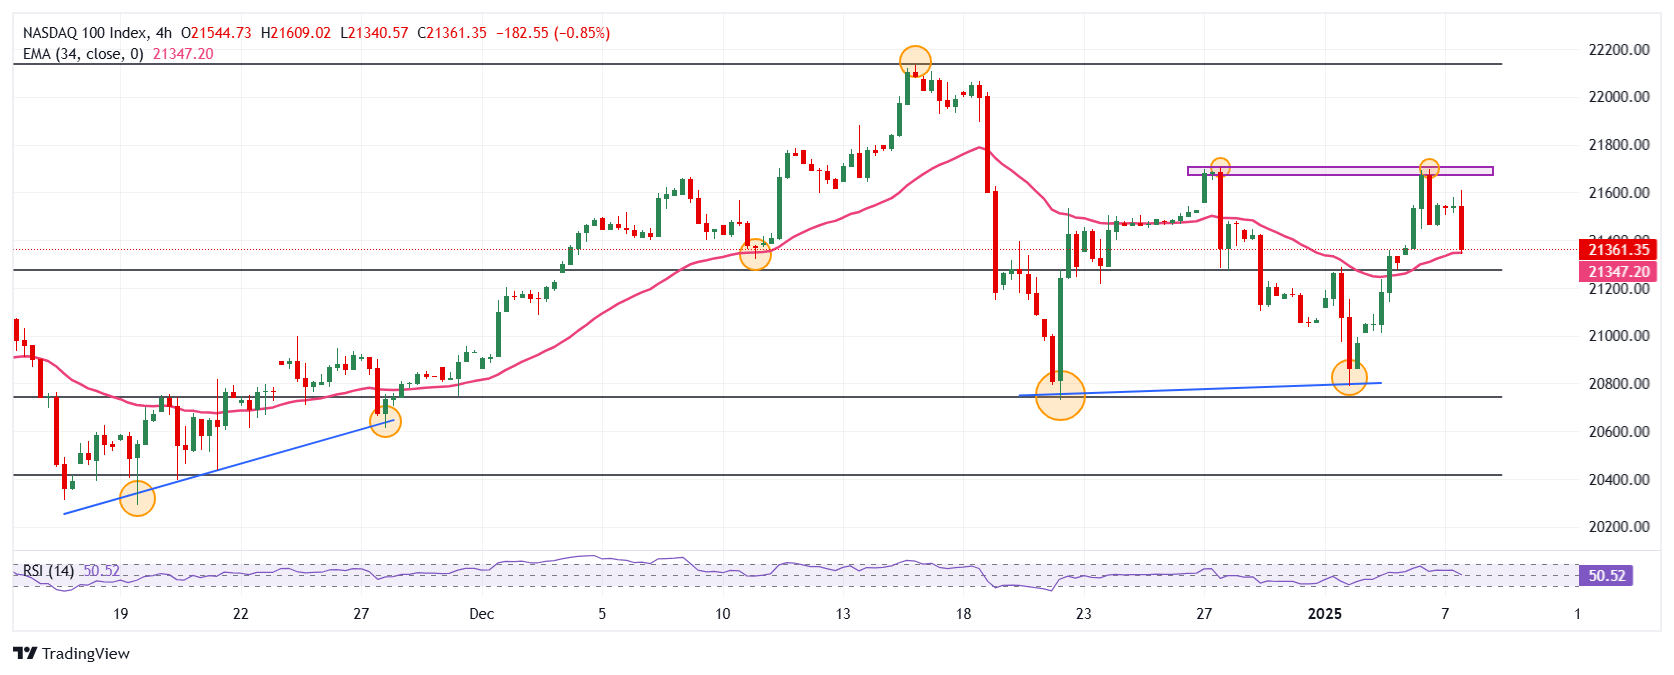
Technical analysis of the Nasdaq 100
The Nasdaq 100 established short-term resistance given by the January 6 high at 21,697. The closest support is at 20,729, the low of December 20, 2024, in convergence with the 38.2% Fibonacci retracement. When the next major support zone is at 20293, pivot point of November 19, 2024.
Nasdaq 100 4-hour chart
Dow Jones FAQs
The Dow Jones Industrial Average, one of the world’s oldest stock indices, is made up of the 30 most traded securities in the United States. The index is weighted by price rather than capitalization. It is calculated by adding the prices of the securities that comprise it and dividing them by a factor, currently 0.152. The index was founded by Charles Dow, also founder of the Wall Street Journal. In recent years it has been criticized for not being sufficiently representative, since it only follows 30 companies, unlike broader indices such as the S& P 500.
There are many factors that drive the Dow Jones Industrial Average (DJIA). The main one is the aggregate performance of its component companies, revealed in quarterly corporate earnings reports. US and global macroeconomic data also contribute, influencing investor sentiment. The level of interest rates, set by the Federal Reserve (Fed), also influences the DJIA, as it affects the cost of credit, on which many companies largely depend. Therefore, inflation can be a determining factor, as well as other parameters that influence the decisions of the Federal Reserve.
The Dow Theory is a method for identifying the main trend of the stock market developed by Charles Dow. A key step is to compare the direction of the Dow Jones Industrial Average (DJIA) and the Dow Jones Transportation Average (DJTA) and only follow trends where they are both moving in the same direction. Volume is a confirmation criterion. The theory uses elements of maximum and minimum analysis. The Dow theory proposes three phases of the trend: accumulation, when the smart money begins to buy or sell; public participation, when the general public joins the trend; and distribution, when the smart money abandons the trend.
There are several ways to trade the DJIA. One of them is to use ETFs that allow investors to trade the DJIA as a single security, instead of having to buy shares of the 30 companies that comprise it. A prominent example is the SPDR Dow Jones Industrial Average ETF (DIA). Futures contracts on the DJIA allow traders to speculate on the future value of the index, and options provide the right, but not the obligation, to buy or sell the index at a predetermined price in the future. Mutual funds allow investors to purchase a portion of a diversified portfolio of DJIA securities, providing exposure to the global index.
Source: Fx Street
I am Joshua Winder, a senior-level journalist and editor at World Stock Market. I specialize in covering news related to the stock market and economic trends. With more than 8 years of experience in this field, I have become an expert in financial reporting.


