
- The Australian dollar gains ground after the TD-MI inflation index and the data of the China manufacturing PMI published on Monday.
- The manufacturing PMI Caixin of China increased to 50.8 in February from January 50.1.
- The US dollar fights while US PCE inflation data is aligned with expectations, relieving concerns about unexpected inflation peaks in the US.
The Australian dollar (AUD) stopped its six -day streak on Monday, driven by a weaker US dollar (USD) after the publication of inflation data on personal consumption inflation (PCE) of January on Friday. The report was aligned with expectations, relieving the fears of unexpected inflation peaks in the US.
Australia’s TD-MI inflation index fell 0.2% intermensual in February, reversing a 0.1% increase in January. This was the first fall since last August and followed the decision of the Bank of the Australian Reserve (RBA) to cut its interest rate at 25 basic points to 4.1% during its first monetary policy meeting of the year, reflecting a continuous slowdown in the underlying inflation. However, in annual terms, the index increased by 2.2%, slightly below the previous increase of 2.3%.
The AUs also receives optimistic economic data on China. The Purchase Managers Index (PMI) Caixin Manufacturing of China rose to 50.8 in February from January 50.1, exceeding the expectations of the market of 50.3. Given the importance of China as a key trade partner for Australia, the strongest reading of the PMI provided an impulse to the Australian dollar.
However, the AUD’s bullish potential could be limited by the escalation of commercial tensions between the US and China. During the weekend, US President Donald Trump announced an additional 10% tariff on Chinese imports as of Tuesday, adding to the 10% tariff imposed last month. On Thursday, Trump declared in Truth Social that 25% tariffs on Canadian and Mexican goods will take effect on March 4.
The Australian dollar can be seen as concerns about unexpected inflation in the US decrease
- The dollar index (DXY), which tracks the USD compared to six main currencies, weakens after three consecutive earnings sessions, around 107.30 at the time of writing. The drop in the dollar could be limited as the yields of the US Treasury bonds improve, with the yields at 2 and 10 years currently placing 4.02% and 4.24%, respectively.
- The US PCE inflation report complied with expectations, with the monthly general PCE remaining stable at 0.3%. The underlying PCE increased slightly to 0.3% from 0.2% of December, while the annual general PCE stood at 2.6%, slightly above the projections but unchanged with respect to the figure of December. The underlying PCE was reduced to 2.6%, from a revised 2.9% in December.
- Tensions increased between US president, Donald Trump, and Ukrainian leader Volodymyr Zelenskyy during negotiations of a peace agreement. Zelenskyy was expected to sign an agreement that grant the US to the US greater access to rare land minerals of Ukraine and participate in a joint press conference, but the plan was abandoned after a heated exchange between the leaders in front of the media. After the confrontation, in which Trump openly expressed his disdain, the main advisors asked Zelenskyy to leave the White House.
- President Trump signed a memorandum on Friday instructing the Foreign Investment Committee in the US (CFIUS) to limit Chinese investments in strategic sectors. Reuters cited a White House official saying that the National Security Memorandum seeks to promote foreign investment while protecting the US national security interests of possible threats raised by foreign adversaries such as China.
- The purchasing managers index (PMI) S&P Global Australia was reviewed 50.4 in February from an initial estimate of 50.6, but remained above January 50.2. This marked the second consecutive month of improvement in manufacturing conditions and the stronger growth since February 2023.
- China’s manufacturing NBS PMI improved 50.2 in February compared to the previous 49.1. This figure was stronger than the 49.9 expected. Meanwhile, the non -manufacturing NBS PMI rose to 50.4 in February from 50.2 in January, exceeding the estimation of 50.3.
- According to a report by the Wall Street Journal on the perspectives of the Australian Australian dollar Australia (CBA), high commercial war risks promoted by Trump have become a great concern. China’s response to these commercial threats will be a key factor that will shape the future performance of the AU.
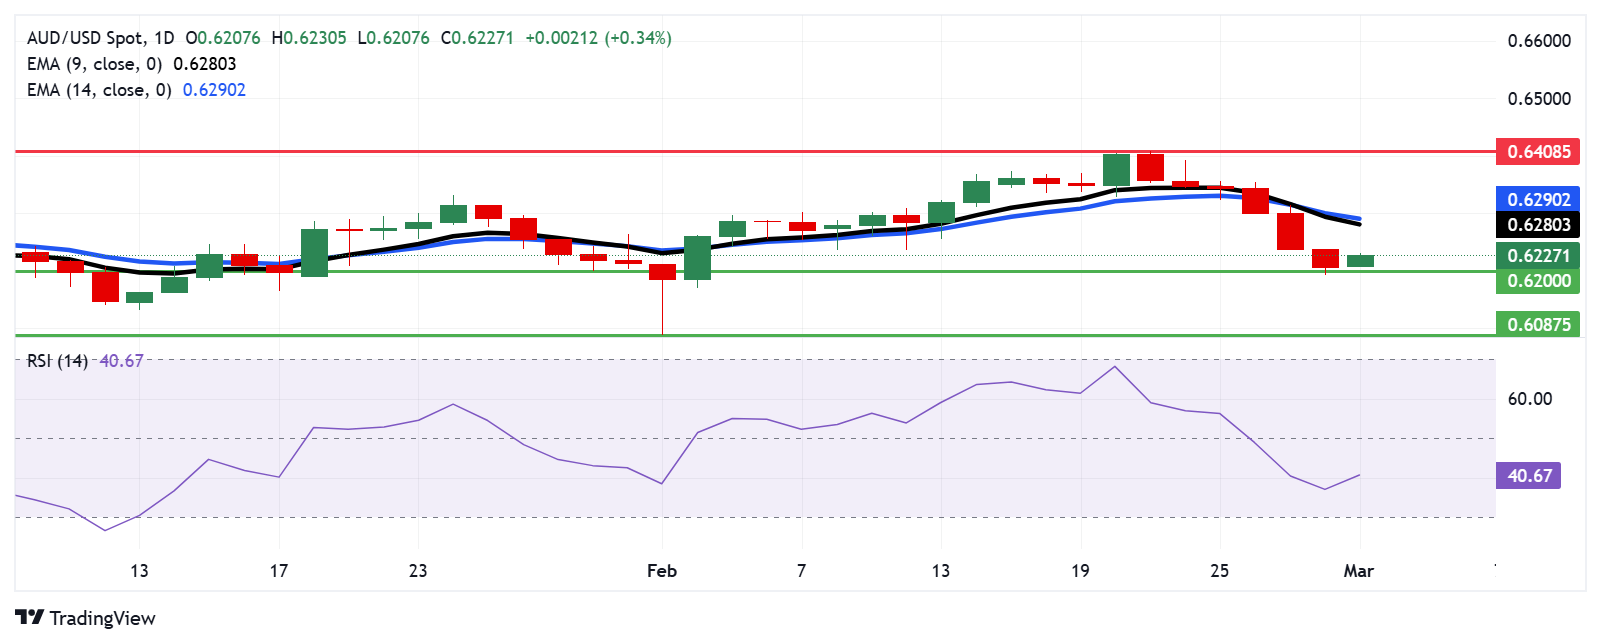
The Australian dollar proves the 0.6200 support in the midst of a prevalent bearish bias
The aud/USD torque is quoted around 0.6220 on Monday. The daily chart analysis suggests that the PAR is still under pressure, quoting below the exponential mobile socks (EMA) of nine and 14 days, indicating a weakening of the short -term impulse. In addition, the 14 -day relative force (RSI) index remains below 50, reinforcing the bassist perspective.
At the bottom, the AUD/USD is currently testing a key support at the psychological level of 0.6200. A rupture below this level could carry the price towards 0.6087, its lowest point since April 2020, registered on February 3.
The initial resistance is observed in the nine -day EMA of 0.6280, followed by the 14 -day EMA in 0.6290. A decisive breakdown above these levels could strengthen the short -term impulse, which could lead to the torque to test the maximum of three months of 0.6408, reached on February 21.
AUD/USD: Daily graphic
Australian dollar Price today
The lower table shows the percentage of change of the Australian dollar (AUD) compared to the main currencies today. Australian dollar was the strongest currency against the US dollar.
| USD | EUR | GBP | JPY | CAD | Aud | NZD | CHF | |
|---|---|---|---|---|---|---|---|---|
| USD | -0.44% | -0.27% | -0.15% | -0.10% | -0.35% | -0.21% | -0.12% | |
| EUR | 0.44% | 0.06% | 0.06% | 0.15% | -0.01% | 0.04% | 0.14% | |
| GBP | 0.27% | -0.06% | 0.13% | 0.09% | -0.07% | -0.02% | 0.08% | |
| JPY | 0.15% | -0.06% | -0.13% | 0.26% | -0.15% | -0.02% | 0.03% | |
| CAD | 0.10% | -0.15% | -0.09% | -0.26% | -0.09% | -0.11% | -0.01% | |
| Aud | 0.35% | 0.01% | 0.07% | 0.15% | 0.09% | 0.05% | 0.15% | |
| NZD | 0.21% | -0.04% | 0.02% | 0.02% | 0.11% | -0.05% | 0.10% | |
| CHF | 0.12% | -0.14% | -0.08% | -0.03% | 0.00% | -0.15% | -0.10% |
The heat map shows the percentage changes of the main currencies. The base currency is selected from the left column, while the contribution currency is selected in the upper row. For example, if you choose the Australian dollar of the left column and move along the horizontal line to the US dollar, the percentage change shown in the box will represent the Aud (base)/USD (quotation).
Economic indicator
PMI manufacturing caixin
The Chinese manufacturing PMI of Caixin, published by Markit Economicsis based on the result of the responses to the monthly questionnaires sent to purchasing executives of more than 400 private companies in the manufacturing sector.
Read more.
Last publication:
Lun Mar 03, 2025 01:45
Frequency:
Monthly
Current:
50.8
Dear:
50.3
Previous:
50.1
Fountain:
IHS MARKIT
Source: Fx Street
I am Joshua Winder, a senior-level journalist and editor at World Stock Market. I specialize in covering news related to the stock market and economic trends. With more than 8 years of experience in this field, I have become an expert in financial reporting.


