
- The S&P 500 remains stable above 4,400 points.
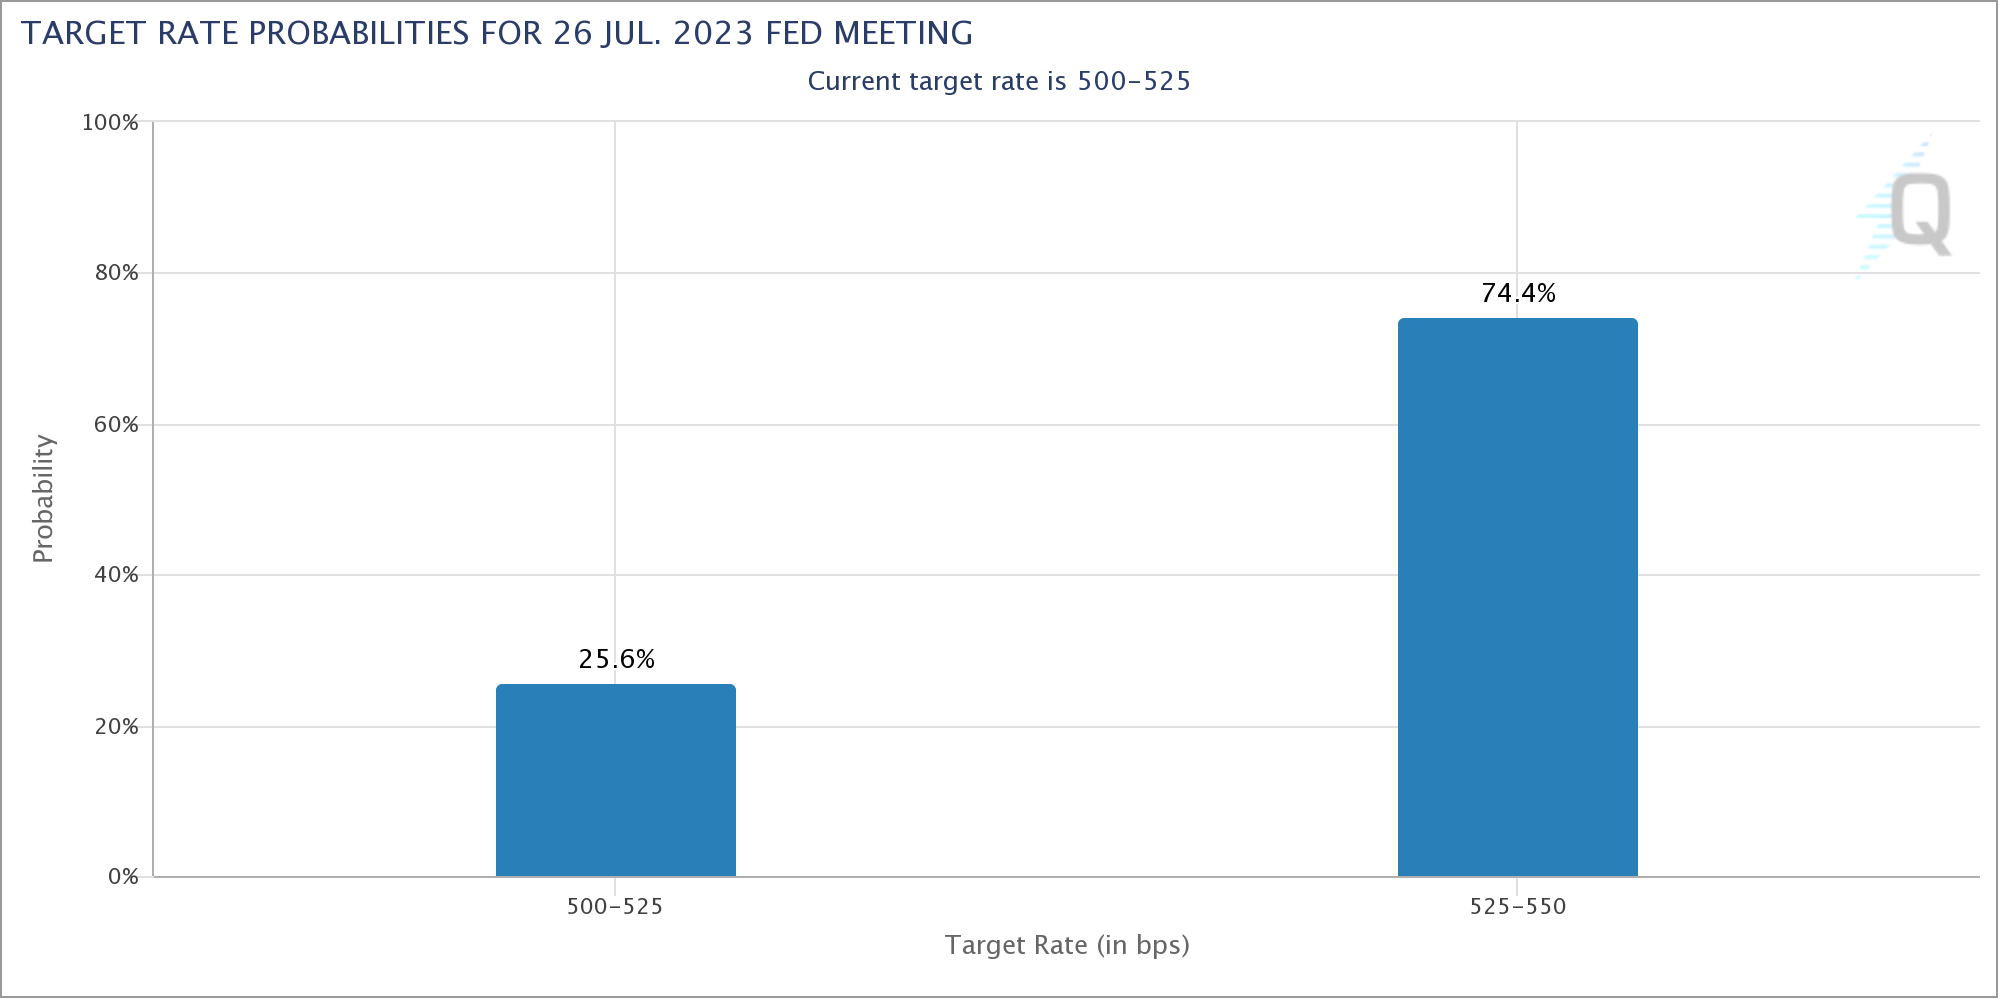
- The Fed decided to leave rates unchanged in June, however it is targeting two further rate hikes by the end of the year.
- This week, the markets’ attention will be on Powell’s testimony before the US Congress.
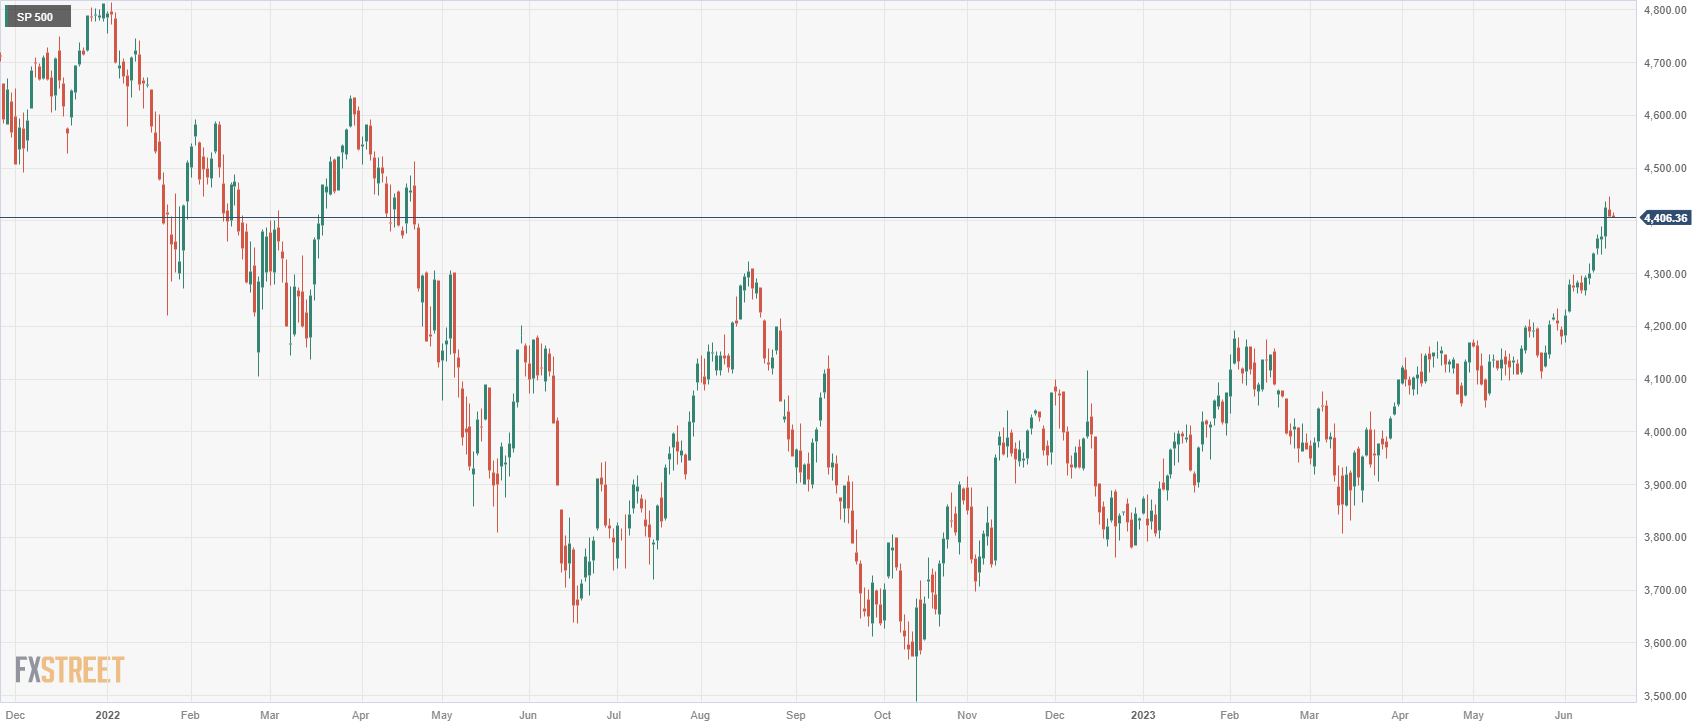
index futures S&P 500 They are largely unchanged above the 4,400 level during the European session on Monday. At time of writing, the index is trading at 4,406, losing -0.03% on the day.
It’s worth remembering that on Friday, the S&P 500 reached its highest level since April 21, 2022at 4,445 points, although it finally fell back and closed at 4,407, with a loss of -0.37%.
The S&P 500 has been extending its recent rally after breaking above 4,200 points earlier this month.
The improvement in sentiment was joined by the decision of the Federal Reserve (Fed) of the United States (USA) to leave rates unchanged in June, as expected. The Summary of Economic Projections showed that the projection of the terminal interest rate for the end of 2023 was revised upwards, standing at 5.6% compared to 5.1% in March, which implies two more 25 basis point rate hikes this year.
No US economic data will be released today, and US stock and bond markets will be closed for the “Liberation Day” holiday, suggesting that market action will remain subdued in the second half of the day.
On Wednesday and Thursday, the chairman of the Federal Reserve, Jerome Powell will testify before the US Congress. and will provide an overview of the economy and monetary policy, which will be closely watched by investors looking for new clues on the future path of rate hikes.
The markets are currently pricing in almost 75% probability of a 25 basis point Fed rate hike next month.
S&P 500 daily chart
S&P 500 technical levels
Source: Fx Street
I am Joshua Winder, a senior-level journalist and editor at World Stock Market. I specialize in covering news related to the stock market and economic trends. With more than 8 years of experience in this field, I have become an expert in financial reporting.


