
- The S&P 500 hits its highest prices in two weeks as stocks rally after weekend jitters in Gaza.
- US stocks fell at the start of the trading week after the Hamas rocket attacks over the weekend, but investors regained their spirits by midday.
- Markets will be watching US inflation figures due mid-week.
He Standard & Poor’s (S&P) 500 Stock Index is trading near 4,330, its highest level in two weeks, after markets recovered early on Monday from risk aversion sparked by escalating tensions in the Gaza Strip over the weekend.
Hamas launched a deadly rocket attack over the weekend that left more than 700 Israelis dead, with at least 12 US citizens confirmed dead in the altercation; Israel’s retaliation left nearly 700 Palestinians dead after the rocket attack, and markets overall are concerned that the biggest exchange of violence for the region in more than a decade will make trade and production in the region difficult.
Oil markets were especially exposed to risk aversion over the Gaza conflict, with concerns that Iran and Saudi Arabia would become involved in the conflict, which could threaten crude oil production, which is already scheduled to be drastically lower than global demand for the remainder of the year.
The S&P 500 hit a daily low of 4,266.90 in early trading on Monday, before recovering above the 4,300 area, and heads into Tuesday’s session testing territory north of 4,330.
Concerns about a spike in US inflation that will keep the Federal Reserve (Fed) away from any interest rate cuts in the near future remain a constant concern for investors, and markets will be watching closely. This week’s inflation data and US consumer sentiment figures.
A series of speeches by Fed officials including Waller, Kashkari and Daly will take place on Tuesday; On Wednesday the latest Production Price Index will be published, for which a slight rebound is expected to 2.3% from 2.2% in the annualized period of September.
On Thursday, the figures for the US Consumer Price Index (CPI) will be released, for which a slight decline is expected in the same period to 4.1% from 4.3%, meaning that inflation would remain very low. above the Fed’s inflation target of 2%.
Closing out the trading week on Friday will be the Michigan Consumer Sentiment Index, which is forecast to decline slightly from 68.1 to 67.4.
S&P 500 Technical Outlook
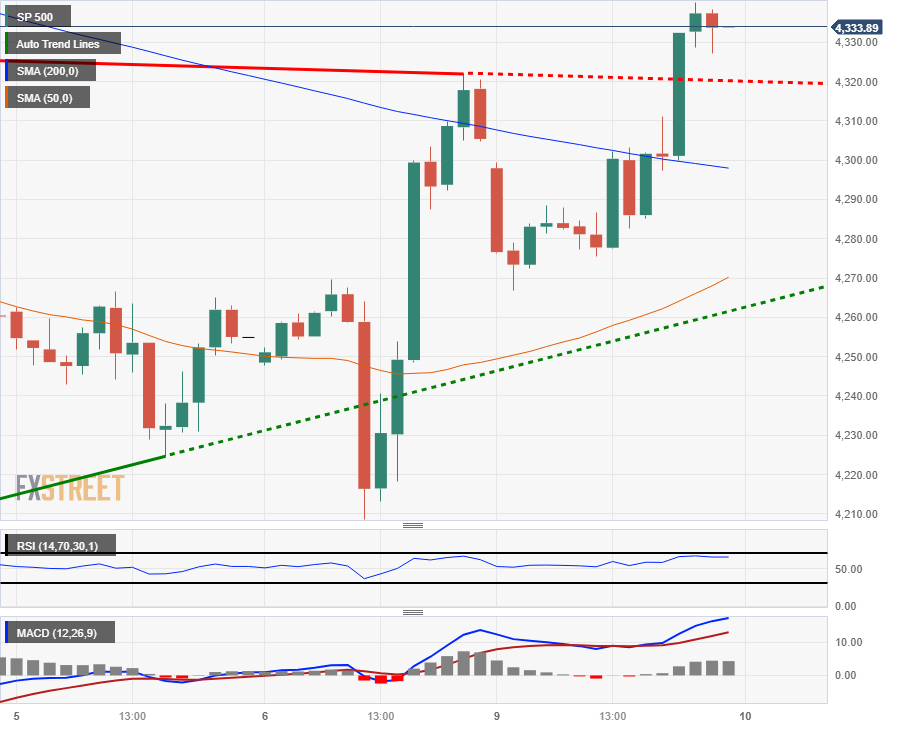
The S&P 500 is on the high side, near 4,333.90, after bouncing from last week’s low of 4,199.80.
The hourly candles managed to break above the 200 hourly simple moving average, and now the bulls will try to convert the recent swing highs near 4,320.00 into technical support to continue higher.
Daily candles have the SP500 building a technical bounce from a rejection of the 200-day SMA near 4,200.00, but market moves may run aground at the technical resistance of the 50-day SMA that sees bearish momentum towards 4,400.00 .
S&P 500 Daily Chart
SP500 technical levels
Source: Fx Street
I am Joshua Winder, a senior-level journalist and editor at World Stock Market. I specialize in covering news related to the stock market and economic trends. With more than 8 years of experience in this field, I have become an expert in financial reporting.


