
- The S&P 500 remains neutral at $4,785.50.
- Market expectations of a 160 basis point easing in 2024 by the Fed ignited flows into stocks in recent sessions.
- The index will close with an annual increase of 24%.
In Friday's session, the index S&P 500 stands at $4,785.50, as bullish momentum appears to flatten on the last trading day of 2023. In this sense, the stock index will close with an annual profit of 24% and adds its ninth consecutive winning week, so downward movements could be on the horizon to consolidate the gains.
Recently, capital flows were redirected towards stocks, as at its last meeting in 2023, the Federal Reserve acknowledged a slowdown in inflation, ensuring that there would be no rate hikes in 2024 and hinting at a 75 basis point adjustment. Since interest rates and stocks are negatively correlated, expectations of a less hawkish Fed next year caused riskier assets to rally.
Meanwhile, US yields are consolidating near multi-month lows. The 2-year rate stands at 4.29%, while the 5- and 10-year yields are at 3.87%, all three with slight advances and with upward movements that seem to limit the increases for the index. Furthermore, the US Dollar as measured by the DXY index also recovered and jumped to 101.35, which also poses a challenge to the S&P.
In the first week of 2024, data related to the employment sector will be published in the United States, a fundamental resource for gauging economic health, which could influence the Fed's expectations. These reports include Non-Farm Payrolls for December , the average hourly earnings and the unemployment rate, all of which are closely followed by the Fed.
S&P 500 Levels to watch
The daily chart indicates a conflict between short-term and long-term market forces, precipitating volatility. Evidently, the Relative Strength Index (RSI) presents flat overbought conditions, a sign of an imminent bearish turn, as traders could look to sell to realize their profits. However, the green bars on the moving average convergence (MACD) histogram point to the bulls retaining some of their momentum.
In a broader context, the index's position above the 20-day, 100-day, and 200-day SMA reflects a long-term bullish outlook. Despite any short-term fluctuations, the weight of these SMAs suggests that the buying force is currently exerting a significant influence on the current trend of the index. Therefore, one should not underestimate the bullish traction in the coming trading sessions.
S&P 500 daily chart
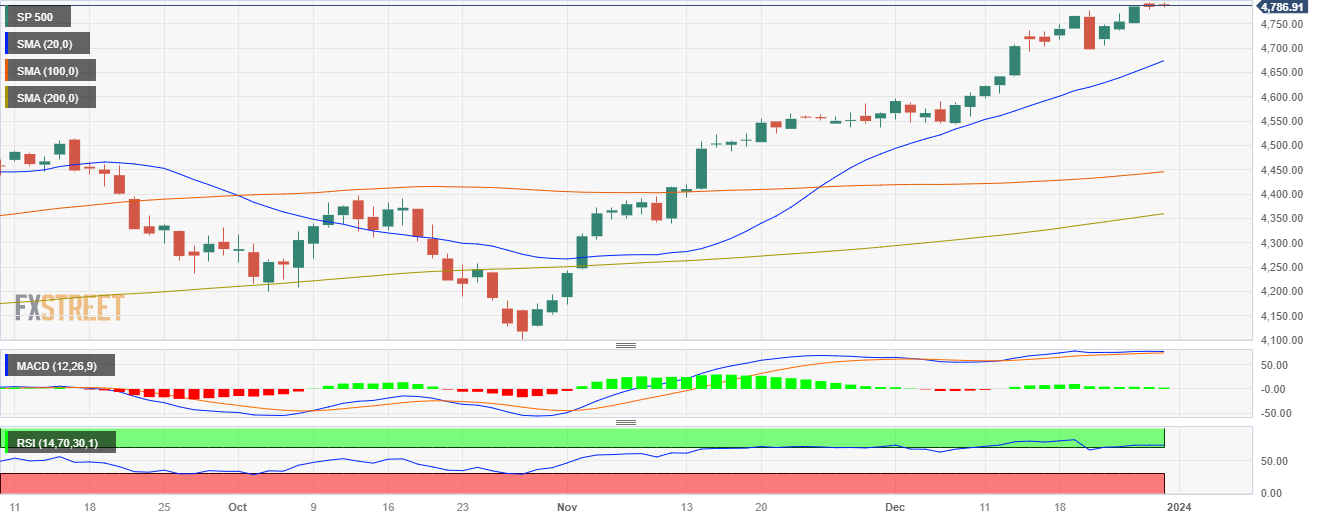
Source: Fx Street
I am Joshua Winder, a senior-level journalist and editor at World Stock Market. I specialize in covering news related to the stock market and economic trends. With more than 8 years of experience in this field, I have become an expert in financial reporting.


