
- Silver tentatively breaks above the trend line, however, is pulling back on Monday.
- It is in a short-term uptrend that could extend further.
The Silver (XAG/USD) has tentatively broken above a key trendline at $30. It is unclear whether the breakout is final, as Friday’s breakout day has been followed by a pullback on Monday that is testing the trendline.
Silver Daily Chart
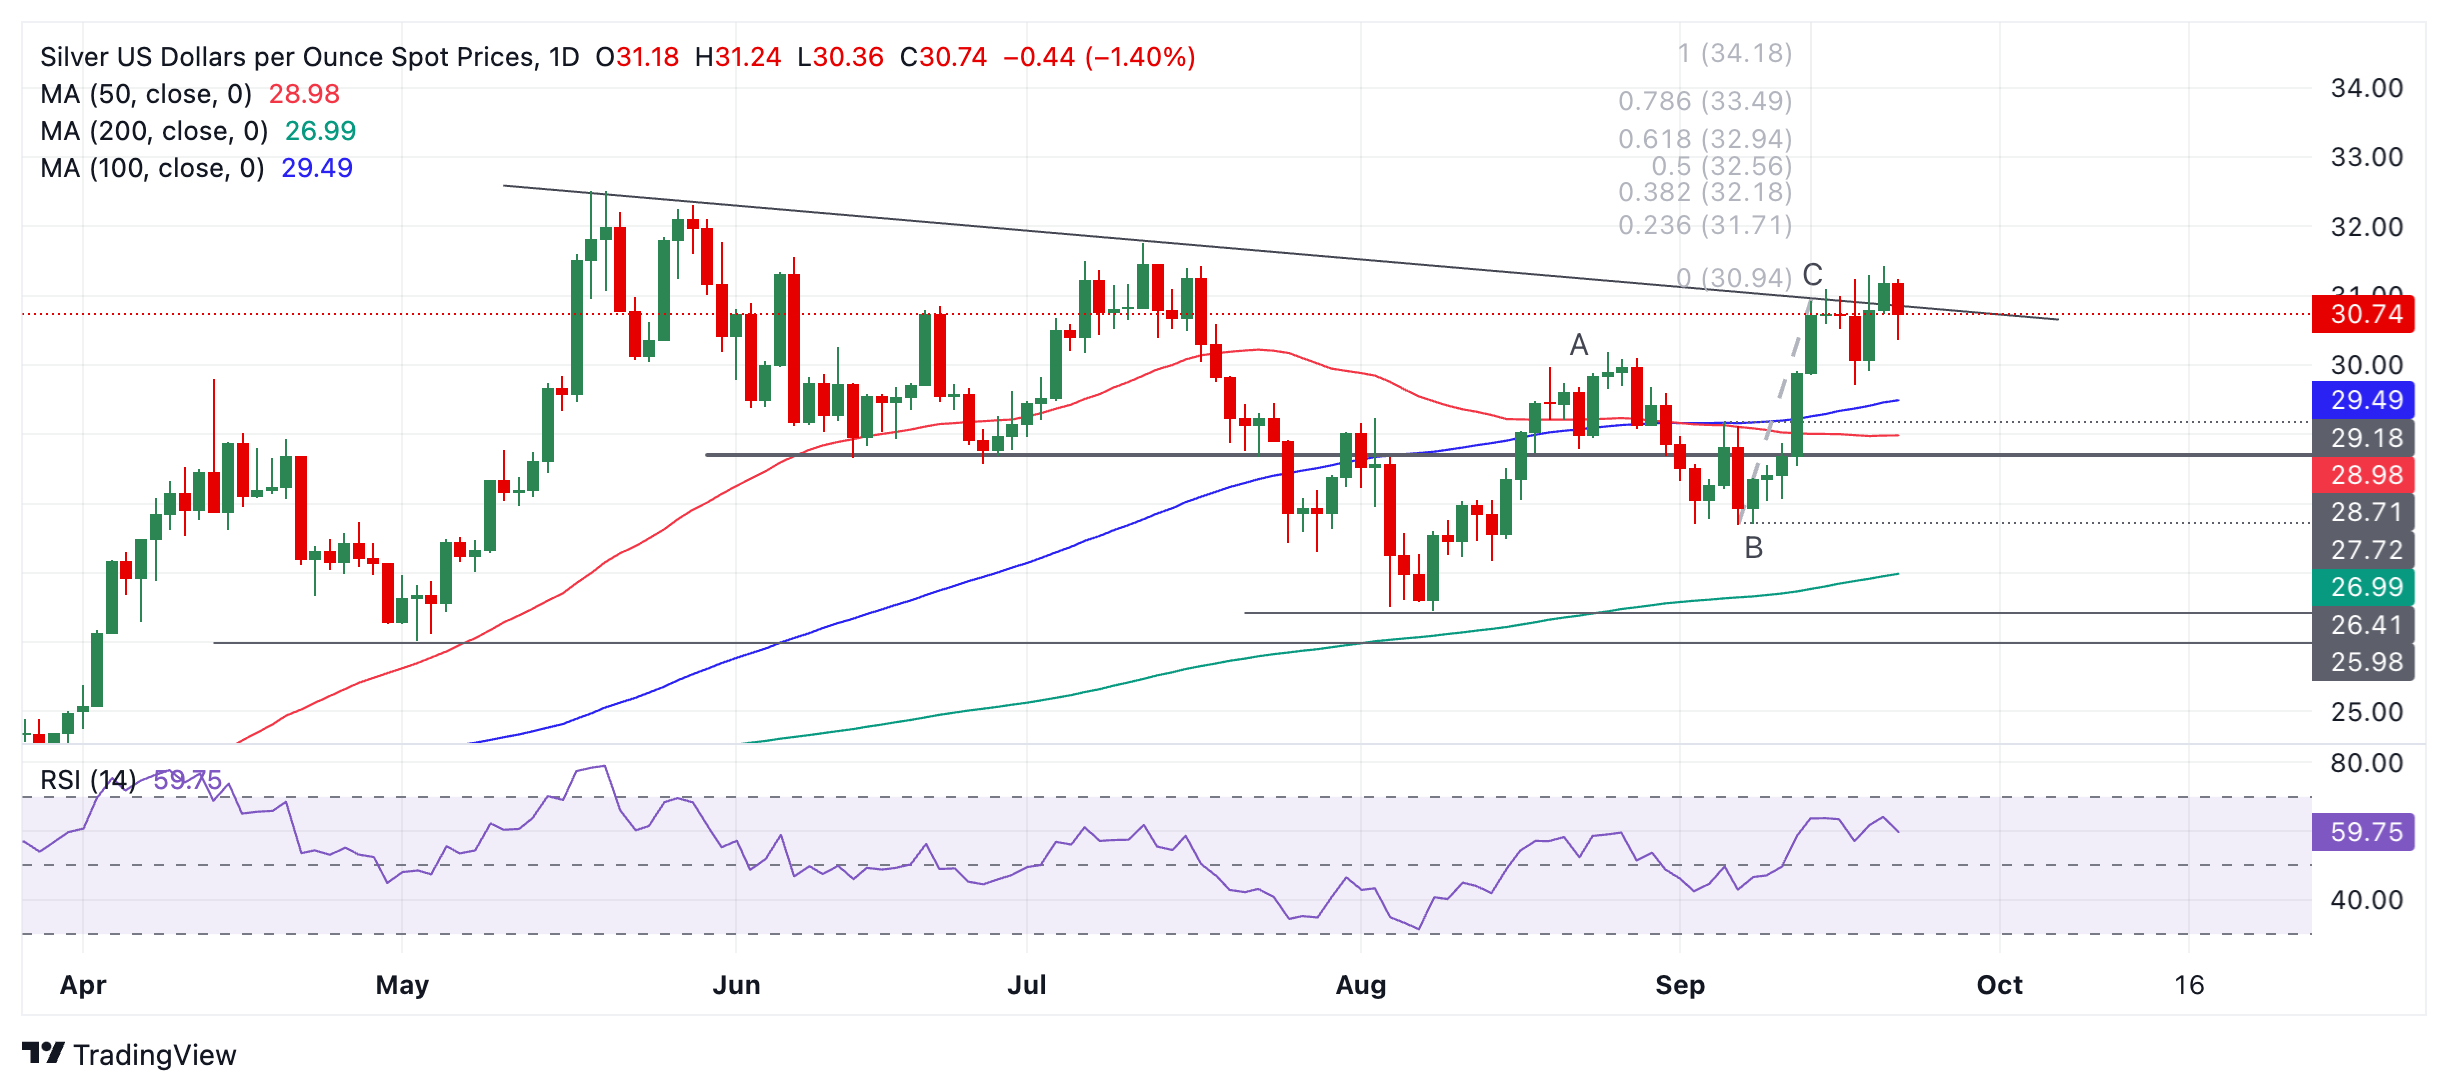
Silver has been in a short-term uptrend since the early August lows, except for a period between August 26 and September 3 when it corrected. As it is a tenet of technical analysis that “the trend is your friend”, the odds favor further upside. A close above $31.43 (September 20 high) would signal a likely continuation to $32.94.
The move higher from the August lows could also be characterized as a Measured Movement price pattern. These are large zigzags made up of three waves, labeled ABC. It is another feature of these patterns that the A and C waves are usually of similar length. This is the case with Silver. This suggests that the pattern may be over and prices could pull back, although there is no way to predict how far. There are no strong signs that it is about to correct.
There is initial support around $29.50 of the 100-day simple moving average (SMA), followed by $29.18 (June lows).
Silver is in a medium to long-term sideways trend that provides no underlying cyclical bias in either direction.
Source: Fx Street
I am Joshua Winder, a senior-level journalist and editor at World Stock Market. I specialize in covering news related to the stock market and economic trends. With more than 8 years of experience in this field, I have become an expert in financial reporting.


